Advanced R Shiny: Use Cases and Applications Workshop
Friday June 26, 2026
1:30 - 4:30 PM
Karl Miller Center, 615 SW Harrison Street, Portland, OR
Room KMC TBD
Advanced selected topics in R/Shiny web application. Shiny modules including:
- Meta-UI framework like ‘Teal’
- Enterprise-ready dashboards
- ‘Crosstalk’ to enable interactivity between multiple HTML widgets on a single web page
- Extended UI or server components
Knowledge Prerequisites: Basic experience in Shiny. Understanding the basic format of a shiny ‘module’.
Pre-Installations: R package Shiny. Also recommended (but not mandatory): LLM pre-installed in your IDE of preference (free co-pilot via github is ok)
Instructor

Dror Berel
Pronouns: He/him/his
Location: Portland, Oregon
Dror Berel is a statistical consultant with over 20 years of work experience in both academia and industry. He loves using R for (almost) everything. He works as an independent consultant, solving business problems and scale analytical tools for diverse data domains, leveraging both traditional Machine learning and Causal Inference along with modern approaches. Among the data domains he specialize in are: genomic biomarker discovery, clinical data reporting (CDISC, ADaM, TLGs). His services also include: Authoring Real World Evidence data analysis and documentation. Writing statistical plans, Power analysis, Design of experiments, and biomarker discovery. Developing R/Shiny apps, and REST APIs. Golem, Rhino, Teal and others.
Alec Kretchun
Evaluating access to healthcare: a modern spatial data workflow in R/python
Regular talk, 3:15 - 4:15 PM
There are many barriers to healthcare access in the United States. To address a subset of physical barriers health plans must understand and monitor the breadth depth and capacity of their provider networks to provide care for their members. Understanding the geospatial relationship between provider networks and the communities they serve is a necessary component for quantifying whether the healthcare network can meet the needs of that community.
Additionally at national state and local levels there are regulations that define what it means for a health care network to physically meet the needs of a community. Network adequacy standards set maximum travel time and/or distance thresholds that any member may travel to access care for a network to be compliant. In total this regulatory framework creates a need for reproducible and accurate methods of measuring physical access to healthcare which is crucial for meeting the needs of both health plan members and regulators.
To quantify potential barriers to healthcare and support efforts to build accessible health care networks for Kaiser Permanente we developed a modern workflow for analyzing evaluating and presenting healthcare provider network metrics. We developed an internal R package that leverages ESRI’s ArcPy spatial analysis library to quantify where in time and space Kaiser Permanente’s health care networks do (and do not) meet the needs of the communities we serve. Those results are then exported into several predefined data models hosted in a PostgreSQL database and made available for analytics workflows via Plumber API endpoints. From there we build both Shiny interactive web applications as well as R markdown documents to create modern data products that decision makers can use to satisfy regulatory requirements and provide actionable information to alleviate member access challenges.
We are excited to submit to the Cascadia R conference to highlight the ways in which R is being used to modernize network adequacy analysis. Many of the analysts that contributed to these projects live and work in Oregon so we also want to share how the data talents of the NW are contributing to the national mission of KP.
 |
Pronouns: he/himLocation: Portland, OR, USAAlec Kretchun is a data professional with Kaiser Permanente, focused on increasing access to healthcare. Alec spent 8 years working in environmental science academic research, focused on landscape modeling and geospatial data analysis. He then made the switch to the private sector, where he focuses on scalable open source solutions to meet regulatory and organizational needs. |
Ariane Erickson
Top Features Every Public Health Dashboard Needs (and how to build them)
Regular talk, 3:15 - 4:15 PM
Building a public-facing dashboard is a balancing act. While crafting a compelling story from your data it is easy for dashboard design principles to become muddled in the competing priorities: user needs internal partner requests and performance of the dashboard. Navigating these challenges requires a strategic approach and in this talk I will highlight key considerations for publishing effective public health dashboards using R Shiny.
Accessibility is the first critical element of a public-facing dashboard. While the performance and reactivity may shine if the dashboard is difficult to read or decipher it risks being overlooked. Designing with optimized contrast and typography in mind ensures that your dashboard can reach all users and won't be dismissed at first glance.
Next consider how users will interact with the data and content. While interactive hover boxes and dynamic plots are engaging and can draw users in to keep users engaged users will want to download the data for analysis in their own workflows. Integrating CSV downloads and filtered data views can add value to your dashboard.
Finally don't overlook the importance of a robust iterative review process. From spotting spelling errors to ensuring plots reflect accurate data continued testing is essential. How will you know if your dashboard is meeting expectations? Regular internal and external review along with a robust user feedback loop can provide invaluable insights to help refine features and improve usability. In this talk I will walk through our review process and share techniques for integrating feedback into your R dashboard development process.
 |
Pronouns: she/herPortland, OR, USAAriane Erickson is a public health data scientist who builds R-powered dashboards and analytic tools to support data-driven decision-making. She currently leads data projects for Oregon's prescription drug monitoring and injury prevention programs. Before transitioning to public health, she earned a PhD in materials engineering with a focus on cancer biomaterials and led R&D at a medical device startup. Her work bridges the gap between research and real-world impact. |
Arilene Novak and Andie Hendrick
Workshop to Workflow: Automizing Weekly Respiratory Reports with Quarto
Regular talk, 3:15 - 4:15 PM
As influenza and respiratory syncytial virus (RSV) epidemiologists for the Oregon Health Authority (OHA) we are tasked with publishing weekly reports that summarize respiratory virus surveillance trends in Oregon. Our original process for generating these reports utilized SAS Microsoft Excel Microsoft Publisher with manual copying and pasting of graphs. This largely manual workflow was both time-consuming and susceptible to human error. In June 2024 we had the opportunity to take the Quarto workshop offered at the R Cascadia conference. This workshop provided us with the tools and skills to convert our manual reporting process to a fully automated report creation process using Quarto for both influenza and RSV. In the future we plan to convert additional surveillance reports to automated processes using the tools learned in the Cascadia R Quarto training. We are also exploring the use of internal Quarto dashboards to monitor weekly respiratory virus hospitalization rates and implement additional quality improvements projects. Links to RSV and flu report
 |
Pronouns: she/her; she/herAlbany, OR, USA; Portland, OR, USAArilene Novak and Andie Hendrick work together at the Oregon Health Authority (OHA) as RSV and influenza epidemiologists. They've been working together since 2022 with the focus of creating streamlined surveillance and reporting practices. Arilene lives in Albany with her husband, corgi, and 2 cats and enjoys gardening and Mexican food. Andie lives in Portland with her partner and spends her free time riding bikes, cheering for the Portland Thorns, and working on home improvement projects. |
Ben Matheson
Supercharge your work with Github Actions for R
Regular talk, 11:20 AM - 12:20 PM
Learn how to use Github Actions with R to automate your work, scrape the web, build powerful reports, and so much more. This talk will explore the spectrum of use cases, the structure of an action, how to securely use credentials, and techniques to test and deploy your action. After this talk, R users will be prepared to create and launch their first action quickly with a scheduled Github Action.
 |
Pronouns: he/himAnchorage, AK, USABen Matheson is the Data Analyst for the Anchorage Innovation Team inside the city government of Anchorage, Alaska. He works with departments to improve the lives of city residents and help people do their best work. He loves to builds websites and visualizations to bring complex topics to life. At the start of his career, worked as a public radio reporter across rural Alaska. benmatheson.com |
Bryan Shalloway
Prediction Intervals in Tidymodels
Lighting Talk, 1:25-1:30
In the evolving landscape of statistical modeling and machine learning, the tidymodels framework has emerged as a powerful suite of packages that streamline the predictive modeling process in R and that fit nicely within the greater tidyverse. While predictions get more attention, in many contexts you are asked not just to produce a point estimate but also a range of potential values for each individual prediction. In this talk, I will provide a very brief overview of the tidymodels ecosystem followed by a discussion of the different methods you may want to use to produce prediction intervals and how these may be outputted using tidymodels. Primarily I will focus on regression contexts (i.e. when your target of interest is continuous) and will touch on analytic methods, quantile based approaches, as well as simulation / conformal inference based approaches. I wrote a series of posts on these topics a couple of years ago that I will draw from in crafting the talk: * Understanding Prediction Intervals: Why you’d want prediction intervals, sources of uncertainty and how to output prediction intervals analytically like for Linear Regression https://www.bryanshalloway.com/2021/03/18/intuition-on-uncertainty-of-predictions-introduction-to-prediction-intervals/ * Quantile Regression Forests for Prediction Intervals: quantile methods (e.g. in the context of Random Forests) for producing prediction intervals: https://www.bryanshalloway.com/2021/04/21/quantile-regression-forests-for-prediction-intervals/ * Simulating Prediction Intervals: a broadly generalizable way of producing prediction intervals by simulation. https://www.bryanshalloway.com/2021/04/05/simulating-prediction-intervals/ I will summarize and update the content from these posts (e.g. the code in them is not up-to-date with the current tidymodels API) and focus more on conformal inference. In this latter aim, I will draw heavily from materials produced by Max Kuhn, e.g. his Posit Conf 2023 talk describing support for conformal inference now available in the {probably} package (https://www.youtube.com/watch?v=vJ4BYJSg734 ). I would also provide some intuition on how to think about conformal inference based prediction intervals, synthesizing tidymodels’ documentation with materials from Anastasios N. Angelopoulos and Stephen Bates (e.g. from this presentation and the associated paper: https://www.youtube.com/watch?v=nql000Lu_iE ). Although there are some reasonably niche/advanced topics here I would keep the talk as high-level and intuitive as possible.
 |
Pronouns: he/himSeattle, WABryan lives in Seattle. He has worked in Data Science at NetApp since 2017 where he has led projects on a wide range of problems with different teams in customer support, sales, and pricing. |
Building Rust based R Packages Workshop
Friday June 20, 2025
1:30 - 4:30 PM
Karl Miller Center, 615 SW Harrison Street, Portland, OR
Room KMC 465
This workshop will teach developers how to build a Rust based R package using the extendr Rust library and {rextendr} R package. Participants will create a performant package from the ground up using Rust.
Knowledge Prerequisites: This workshop is focused on creating R packages using Rust. Participants are expected to understand the basics of creating an R package. This includes familiarity with {roxygen}, {devtools}, and important package files such as DESCRIPTION and NAMESPACE. If you are interested but do not know how to make an R package, spend a weekend reading R Packages (2e).
Instructor

Josiah Parry
Pronouns: He/him/his
Location: Seattle, Washington
Josiah Parry believes R belongs in production. He has a penchant for writing R packages that are really fast and efficient. Typically, this involves writing Rust and glueing R them together using extendr. He also, quite specifically, likes solving geospatial problems. He works at Esri doing spatial statistics and —you guessed it— writing R packages.
Learn more at josiahparry.com.
C. Nathalie Yuen
Come TogetheR, Right Now, OveR R
Inspired by the musical contributions of the Pacific Northwest, the focus of this 5-minute lightning talk is the Top 100 Billboard charts. In addition to using the Billboard charts to learn about R/RStudio, this talk will also discuss using Tidy Tuesday as a resource, developing interdisciplinary skills, and forging relationships within collaborative groups. The “Top 100 Billboard” is a Tidy Tuesday (Mock, 2022) activity that includes song, artist, and chart information from the Billboard Chart, as well as song audio information from Spotify. Although this could be used across a variety of situations, from an introduction to R/RStudio to settling arguments in social situations, this talk will focus on use in an undergraduate classroom. The talk will include a description of an in-class activity and general reflections on use of R/RStudio in the classroom. Music journalist and author, Rob Sheffield (2010) wrote, “Bringing people together is what music has always done best” (p. 12) but this talk will suggest that, “Bringing people togetheR is what R has always done best.”
 |
Pronouns: she/herOlympia, WA, USADr. C. Nathalie Yuen is a member of the faculty at The Evergreen State College in Olympia, WA. She earned her Ph.D. in Psychology at the University of Nebraska at Omaha. Dr. Yuen primarily uses R for data visualization and in-class activities. |
Cameron Ashton
Building R Packages to Deliver Generalized Functions: An Example from Small Number Suppression for Epidemiological Dashboarding
Lighting Talk, 1:45-1:50
“Background: The Data Visualization Section within the Center for Data Science at the Washington Department of Health produces several public disease surveillance dashboards. In these products, we perform small number suppression of the data to prevent case reidentification and discourage misrepresentation of unstable small counts. Suppression includes several layers of logic to obscure small numbers, hide additional cells that could be used to back-calculate values, and remove metrics derived from suppressed values. To accomplish this, we developed a common system of user-defined functions compatible with all our dashboard pipelines. We share our experience organizing this dynamic shared code into an R package used across multiple data processing workflows.
Methods: We imported our system of suppression functions into an R package, which also existed as an R project and GitHub repository. The package housed the suppression code and extensive documentation, including sample data and tutorial vignettes. Dashboard refresh scripts were updated to install the package from GitHub and call its exported functions. We monitored script length, ease of process updates, and duration time of our refreshes to identify workflow improvements, and then subsequently engaged in post-mortem discussions to assess the project and its utility for the agency.
Results: We successfully integrated the suppression R package into the production of three public dashboards. Generalizing the functions for the package improved the speed at which they ran, reducing data processing time by approximately 50%. We eliminated numerous redundant code lines from our dashboard scripts and now make changes solely in the package source code rather than repeatedly updating hard-coded scripts. In a post-mortem assessment of this project, our team epidemiologists estimated that this saves approximately 1-2 days of development each time new features are added to a dashboard. Everyone in our agency GitHub enterprise can view the underlying suppression code, download the package, and access its functions.
Conclusion:
Using this approach, we developed sharable code and readily applied our small number suppression process to multiple dashboards for improved data security. The ease with which new dashboard projects can incorporate suppression by way of the R package made our process more future-compatible. Housing generalized source code within an R package significantly reduced staff burden and points of error during development. However, this method is not well-tested within our agency and is most appropriate for common functions that are shared across multiple projects.”
 |
Pronouns: she/herSeattle, WACameron Ashton is an epidemiologist with Washington State Department of Health’s Center for Analytics, Informatics, and Modernization, where she and her team work as R coders to construct pipelines that process data for agency dashboards. Previously, Cameron developed water, sanitation, and hygiene capacity assessment tools as an ORISE fellow at the Centers for Disease Control and Prevention. Cameron received her MSPH in Epidemiology from Emory’s Rollins School of Public Health. |
Cari Gostic
RShiny, Big Data and AWS: A tidy solution using Arrow
The Arrow package facilitates a low-effort, inexpensive transition from a local to cloud-based RShiny infrastructure. It is a relatively new and underutilized tool that requires no additional software licensing, integrates seamlessly with the Tidyverse, and leverages the analytic- and memory-efficient data formats offered by Apache (e.g. Parquet and Feather). In collaboration with the U.S. Environmental Protection Agency, my team built a dashboard to visualize nationwide hourly air quality data from 2010 through the present. Currently exceeding 34 million rows, this dataset expands further each week as recent data is uploaded. The initialization time for this app using a standard RShiny setup where all data is uploaded in an .RData file exceeds two minutes with additional loading for data-intensive visualizations within the app. In this talk, I will demonstrate how we improved dashboard loading times to seconds using an AWS S3 bucket, three functions from the Arrow package, and fewer than 20 new lines of code throughout our entire workflow.
 |
Pronouns: she/herSeattle, WA, USACari joined Sonoma Technology’s Data Science Department in 2020. In addition to her analytical experience in catastrophe modeling for the insurance industry, she has extensive experience in data processing and analysis, model development, and effective data visualization. She is currently involved in a variety of projects, including dashboard development, exceptional event analyses, and refinery monitoring. Cari earned her BS in Atmospheric Science from Cornell University and her MS in Data Science from the University of British Columbia. |
Colleen O'Briant
Teaching Programming with Tidyverse Koans: A Journey of Successes and Failures
This talk is about my successes and failures using koans as a pedagogical tool for teaching programming using the tidyverse.
My Economics PhD began in a more or less standard way: we spent a harrowing first year learning about things like Lagrangian multipliers, hyperplane separation, and Bellman equations. Then, in the spring quarter, we were asked to teach ourselves to program in R and Julia (at the same time, of course). I developed a severe and debilitating but thankfully transitory mental block around writing for loops, yet somehow I was selected to teach R programming labs for the next PhD cohort. Perhaps as a way to process my feelings about that first year, I dove into trying to make teaching materials that didn't feel so scary, isolating, and frustrating.
That project developed into a sort of raison d'être for me through the PhD program. I collected advice from people who know much more about teaching programming than me, and I kept iterating on the materials. Now, as my PhD comes to a close, I've taught R seven different times in seven different econometrics courses, and I think my methods are finally worth sharing. (As an aside: I still don't know the first thing about Julia).
To summarize my vision statement: If we want to teach programming in a more inclusive way, what I've discovered is that the tidyverse is a great place to start, but using tidyverse koans can be even better.
What are koans?
Koans are short programming exercises that show students fundamentals, expose them to what's possible, and challenge them to apply what they've learned and form new connections. Ruby koans popularized the concept, and now there are Lisp koans, Python koans, Clojure koans, and many more, including my tidyverse koans. Something unique about koans is that there are built-in tests which students can run at any point to verify they're on the right track. It also introduces “test-driven development” to students as a fundamental building block.
How are koans similar and different from LearnR?
Both koans and LearnR are simple to build yourself, but koans are meant to be used in something like RStudio, not in the browser. With koans, there are no training wheels.
What are koan shortcomings?
There's an impulse when writing koans to keep ramping up the difficulty, but it's important to fight that impulse or else students will lose confidence. A koan can also only teach so much at a time, which is why just this month I’ve started to test koan read-alongs in both video and zine formats.
 |
Pronouns: she/herEugene, OR, USAColleen O'Briant is an Economics PhD student at the University of Oregon and anticipates graduating in June 2024. Her research is on building the econometrics of AI/ML tools, with the goal of enhancing trust and transparency in this rapidly evolving field. She will be on the job market for the 2023/2024 academic year. |
David Gerbing
Simplified Data Analysis
Regular talk, 9:40 - 10:40 AM
My lessR R package is intended to reduce programming for data analysis to a small set of simple function calls. The user's choice of programming language becomes immaterial because programming skills in any language become immaterial. Moreover most modern development environments are multilingual. For example R of course can be run from the highly popular and highly functional RStudio environment or from the highly popular and highly functional Python environment offered by Jupyter notebooks.
lessR features:
- Require only the minimal logical set of information needed to perform a complete data analysis including BarChart() Histogram() ScatterPlot() ANOVA() Regression() Logit() pivot() and a few others including confirmatory and exploratory factor analysis against those unknown values. For example:
- To have a bar chart of the variable Dept for the number of people who work in each department of the company do the following: BarChart(Dept). This function relies upon the default name of the input data table named d. Or provide the data= parameter. Or use the abbreviation bc() to enter even fewer characters bc(Dept).
- To plot a time series of daily price data aggregate by quarter and then do an exponential smoothing forecast for the next four quarters that provides a visualization of the data the fitted values from the data the forecasted values and the prediction intervals:
Plot(Quarter Price ts_ahead=4 ts_unit="“quarters”")
Unlike standard R functions dates can be read from several formats and then automatically and implicitly converted to an R date variable.
-
Each data visualization function provides both visualizations and statistical output by default. For example the BarChart() function provides the frequency distribution of counts and percentages along with the corresponding chi-square test. The regression analysis such as with Regression(y ~ x1 + x2) provides multiple visualizations and a comprehensive set of statistical analyses including if desired a multi-page interpretive narrative of the results.
-
Unlike the usual R practice of providing many functions for a data analysis and having limited parameter options within each function the documentation for a type of lessR data analysis is found in a single location: the corresponding function's help file. Within each help file the available parameters are organized by type with extensive documentation. To complement these readily available manuals such as by entering ?BarChart extensive examples are also provided for each type of analysis.
-
Bottom-up vs. top-down approach. With the typical bottom-up construct a minimal default visualization. Add enhancements with additional options. The flipped perspective of lessR follows a top-down approach: The form of the visualization perceived as the most desired is the default. Assign parameter values to remove unwanted default components.
-
Regarding the R visualization standard ggplot2:
- The quality of lessR visualizations and the customization options yield the same quality as ggplot2 visualizations without compromise.
- Whereas ggplot2 provides a wonderfully comprehensive graphics programming language for virtually unrestrained creativity lessR seeks to provide a straightforward means of obtaining the vast majority of visualizations and related statistical analyses encountered in data analysis without programming indeed with minimal key strokes.
 |
Pronouns: he/himPortland, OR, USADavid Gerbing is a Professor in the School of Business, Portland State University, with primary teaching responsibility in the Applied Science Data Science for Business graduate degree program. David developer of the R package lessR that accomplishes more output with less R coding. Ph.D in 1979 from Michigan State University in what would now be called Data Science. |
David Keyes
How to Convince Your Teammates to Learn R
If you're attending an R conference Saturday in the middle of summer, I probably don't need to convince you that R is great. If you, like me, love R, it can be tempting to try to get everyone you know to use it. It's painful to watch people struggle to do basic things in other tools that you know can be done easily in R. It's especially painful if you work in an organization where you're the only R user. If you could just get others to learn R, you think, imagine all of the things you could accomplish.
How do you convince people to learn R? In running R for the Rest of Us for the last three and a half years, I've thought a lot about this question. In this talk, I'll share some of the lessons I've learned for convincing others to learn R. Things like:
- Strategies for making R feel less intimidating for newcomers.
- Starting with the end products that people can produce with R rather than the technical steps required to get there.
- Teaching people what they need to know (and no more) so they can more easily get started with R.
Despite our best intentions, it can be easy for more advanced R users to overwhelm newcomers with the myriad things R can do. If you want others to take up R, it's important to put yourself in the mindset of other people. This talk with show how to do that and, hopefully, help you convince others to join you in using R.
 |
Pronouns: he/himPortland, OR, USADavid Keyes is the CEO and founder of R for the Rest of Us. Through online courses and trainings for organizations, R for the Rest of Us helps people learn to use R. In addition to its education work, R for the Rest of Us does consulting, developing reports, websites, and more to help organizations use R to improve their workflow, and much more. |
David Keyes
How to Make a Thousand Plots Look Good: Data Viz Tips for Parameterized Reporting
Regular talk, 11:10-11:25
Data visualization is complicated enough when you are making one plot. Now imagine you're making multiple plots in multiple reports. How can you design your data viz so that it will be legible, attractive, and compelling? This is a challenge that we often have at R for the Rest of Us. We regularly work with clients to make parameterized reports. There may be dozens of plots in each report, and dozens of reports. It's a lot of plots! We've learned to use techniques like selectively hiding text labels where they would be hard to read, using packages like ggrepel to ensure labels do not overlap, employing shadows to make things visible, and more. In this talk, I will give examples, complete with detailed code, of how to make data viz shine when using parameterized reporting. Developing data visualization for multiple reports requires a unique set of considerations. Join me for this talk, where I will discuss the lessons we have learned over the years and show how you can make high-quality data visualization in your own parameterized reports.
 |
Pronouns: he/himPortland, ORDavid Keyes is the CEO and founder of R for the Rest of Us. Through online courses and trainings for organizations, R for the Rest of Us helps people learn to use R. In addition to its education work, R for the Rest of Us does consulting, developing reports, websites, and more to help organizations use R to improve their workflow, and much more. |
David Keyes
25 Things You Didn't Know You Could Do with R
Keynote, 9:10-9:40
 |
Pronouns: he/himPortland, ORDavid Keyes is the CEO and founder of R for the Rest of Us. Through online courses and trainings for organizations, R for the Rest of Us helps people learn to use R. In addition to its education work, R for the Rest of Us does consulting, developing reports, websites, and more to help organizations use R to improve their workflow, and much more. |
Deepsha Menghani
Learning to create Shiny modules by turning an existing app modular
Shiny is an extremely powerful tool to create interactive web applications. However the code for shiny application can get really long and complex very quickly. Modules are a great way to organize the applications for better readability and code reusability. This talk will delve into how you can learn the concept of modules by breaking down an existing app structure into various components and turning them into modules one step at a time. Attendees will learn the fundamentals of module creation, implementation, and communication between modules.
 |
Pronouns: she/herSeattle, WA, USADeepsha Menghani is a data science manager at Microsoft. Her work focuses on investment impact analysis and propensity modeling. When she is not geeking out over data, she is knitting or collecting yarn. |
Deepsha Menghani
Why is everybody talking about Generative AI?
Join me on an exciting journey into the world of Generative AI, where creativity meets innovation. Through various practical scenarios, we'll explore how applications built on GenAI have been a game-changer across industries. Let’s imagine where you can use GenAI applications all around you, from summarizing patient history in healthcare to creating dynamic FAQ sections on your Shiny website. But do these applications always provide relevant answers?
 |
Pronouns: she/herSeattle, WA, USADeepsha Menghani is a Data Science and AI Manager at Microsoft, where she harnesses the transformative power of Data Science in partnership with marketing and customer support. She applies her deep expertise to shape campaign strategies and enhance customer engagement. Beyond her technical acumen, Deepsha champions a culture of diversity, equity, and inclusion, mentoring a team of talented data scientists to achieve strategic objectives and foster innovation. |
Dror Berel
Tidy everything… How I finally got to dive in Time series, Tree and Graph/Network data structures and analysis, thanks to their tidy packages
For years I was trying to learn and use R data structures such as xts for time series, dendograms for trees, and graphs from the igraph package. Perhaps what made it difficult and less intuitive was that there was always some piece of the data structure hidden in the class, or not printed in the default abstraction of the object/class and its projections. This was finally clearly visible with the tidy approach, that defines a tidy tabular structures for the different components, and enforce a cohesive system around it to ensure the more complex stuff is properly handled behind the scenes. In this talk I will review some examples: the tsibble object from the tidyverts ecosystem, the treedata object from the tidytree ecosystem, and the tbl_graph object from the tidytgraph package. I will also demonstrate how I leveraged tibble’s nested structure to embed S4 objects into columns, and systematically operate on them with a purrr (row-wise) manner.
 |
Pronouns: he/himSeattle, WA, USADror Berel is a statistician with over 20 years of work experience in both academia and industry. He loves using R for (almost) everything. One time he even drew a heart with his spouse's name for Valentine's day, using R of course. He works as a consultant, solving business problems and scale analytical tools for diverse data domains, leveraging both traditional Machine learning and Causal Inference along with modern approaches. |
Dror Berel
High-level, module-based R/Shiny apps with ‘Teal’ framework, with applications beyond the pharma data domain
Regular talk, 1:25-1:40
The Teal package(s) ecosystem is a recent framework for R/Shiny apps leveraging ‘modules’, designed for pharma clinical trials data domain. ‘Modules’ are pairs of UI and Server functions, designed to reuse code. It utilizes namespace for writing, analyzing, and testing individual components in isolation. The ‘Teal’ framework is ‘high level’, meaning that one can assemble the various shiny components as blocks, without worrying too much about what is going on underneath, which is referred to as ‘low-level’. This way, one can benefit from rich functionality that has already been developed for the framework, and add or modify ad-hoc special ‘touches’ as needed. The talk will review some of the pros and cons, and demonstrate a use-case with non-clinical data domain, and how to modify and customize an existing module to a new functionality.
 |
Pronouns: he/himSeattle, WADror Berel is a statistician with over 20 years of work experience in both academia and industry. He loves using R for (almost) everything. He works as an independent consultant, solving business problems and scale analytical tools for diverse data domains, leveraging both traditional Machine learning and Causal Inference along with modern approaches. Among the data domains he specialize in are: genomic biomarker discovery, clinical data reporting (CDISC, ADaM, TLGs). His services also include: Authoring Real World Evidence data analysis and documentation. Writing statistical plans, Power analysis, Design of experiments, and biomarker discovery. Developing R/Shiny apps, and REST APIs. Golem, Rhino, Teal and others. |
Dror Berel
From Roadblocks to Breakthroughs: Navigating the Challenges of Adopting New Open Source Tools
Regular talk, 11:20 AM - 12:20 PM
Adopting new open-source technology can be both exciting and challenging. While a tool may appear promising and seem like the perfect fit for a specific task early-stage technologies often come with their own set of hurdles. One of the biggest challenges is the lack of comprehensive resources—such as detailed documentation practical examples active discussion boards and community support—which can make it difficult to troubleshoot issues or fully understand the tool’s capabilities. This often requires additional effort experimentation and problem-solving to get things working as intended.
At last year’s Posit Conference I was introduced to a new tool called closeread a Quarto extension designed for vertical scrollytelling. The concept immediately caught my interest because it seemed like an innovative way to enhance storytelling with data. Motivated by its potential I decided to give it a try shortly after the conference. However my initial experience was challenging. The tool was only partially functional and when I encountered technical issues I struggled to find enough supporting resources to resolve them. The available documentation was limited examples were scarce and there wasn’t much discussion happening in community forums. Frustrated by these obstacles I eventually set the tool aside unsure of how to move forward.
Some time later I came across a user-contribution contest that reignited my interest in closeread. This contest motivated me to tackle the tool again but this time with a different mindset. Instead of relying solely on available resources I approached the problem more systematically—digging into the code experimenting with different configurations and learning through trial and error. This hands-on approach combined with the fresh motivation from the contest helped me overcome the technical challenges I had faced earlier. Eventually I was able to get the tool working successfully and in the process I gained a deeper understanding of how to navigate the common pitfalls associated with adopting new technology.
In my talk I will share this learning journey in detail highlighting the strategies that helped me move from frustration to success. I’ll discuss practical approaches for overcoming deployment challenges including how to troubleshoot effectively when documentation is limited how to leverage community resources even when they seem sparse and how to maintain motivation when progress feels slow. I’ll also offer insights into the mindset shifts that can make a big difference—like viewing challenges as opportunities to deepen your technical skills rather than as roadblocks.
Ultimately my goal is to provide attendees with actionable advice that they can apply when working with new or evolving technologies. Whether you’re an experienced developer or someone just starting out with open-source tools I believe the lessons from my closeread experience will resonate and offer valuable takeaways for tackling your own technology adoption challenges.”
 |
Pronouns: he/himSeattle, WA, USADror Berel is a statistical consultant with over 20 years of work experience in both academia and industry. He loves using R for (almost) everything. He works as an independent consultant, solving business problems and scale analytical tools for diverse data domains, leveraging both traditional Machine learning and Causal Inference along with modern approaches. Among the data domains he specialize in are: genomic biomarker discovery, clinical data reporting (CDISC, ADaM, TLGs). His services also include: Authoring Real World Evidence data analysis and documentation. Writing statistical plans, Power analysis, Design of experiments, and biomarker discovery. Developing R/Shiny apps, and REST APIs. Golem, Rhino, Teal and others. |
Ed Borasky
Eikosany: Microtonal Algorithmic Composition with R
Eikosany is an R package for composing microtonal electronic music based on the theories of Erv Wilson. It gives a composer the ability to
- create compositions using a wide variety of microtonal scales,
- manipulate the scores as R data.table objects,
- synthesize the compositions as audio files, and
- export the compositions as MIDI files to digital audio workstations.
In this talk I'll briefly describe the music theory behind Eikosany and walk through a typical composition scenario. At the end, I'll play the resulting composition.
 |
Pronouns: he/himBeaverton, OR, USAM. Edward (Ed) Borasky is a retired scientific applications and operating systems programmer who has been using R since version 0.90.1 on Red Hat Linux 6.2.* Before R there was Fortran and assembler - lots of different assemblers. (Floating Point Systems AP-120B microcode, even.)Besides his main professional use for R, Linux performance analysis and capacity planning, Ed has used R for computational finance, fantasy basketball analytics, and now, algorithmic composition. His music is best defined as experimental, combining algorithmic composition, microtonal scales, and spectral sound design.
|
Emily Kraschel
R Workflows in Azure Machine Learning for Athletic Data Analysis
Regular talk, 10:10-10:25
The fast-paced needs of the University of Oregon Athletics Department contrast with the slow work often required for rigorous data science. Through this project, we have developed a framework with the goal of making the ‘slow work’ a bit faster. Through using R integrated into Microsoft Azure’s Machine Learning Studio, we are able to integrate data, create and collaborate on code and build machine learning pipelines. Azure allows us to create and access cloud computers to run code quicker, use Jupyter notebooks to create and run code in different languages, create modular pipelines and to collaborate as a team. The integration of R into Azure has opened new doors and increased efficiency for our team. This talk will cover the challenges of conducting data science within a fast-paced athletics environment, and how far we have come by using R and Azure for our data analysis.
 |
Pronouns: she/herEugene, OREmily is a Research Data Science Assistant at the University of Oregon for a project regarding injury modeling and prevention. The project is shared by the Data Science and Athletics departments, as part of the Wu Tsai Human Performance Alliance. In addition to her research work, Emily is a Workshop Coordinator for UO Libraries Data Services, where she organizes and instructs programming workshops and data-related events. She received a BS with honors in Economics and International Studies from the University of Oregon, and has plans to attend Syracuse University for a MA in International Relations in Fall 2024. |
Erica Bishop
Don’t repeat yourself: Templatize your R Shiny Apps with Modules
Regular talk, 1:10-1:25
A central philosophy of coding in R is if you find yourself repeating code, it’s time to write a function. The same goes for R Shiny development—if you find yourself repeating code it’s time to modularize. But what about when you find yourself repeating features and functions across different apps? Then it’s time to make a template. In this talk, you’ll learn when, why, and how you can reuse your app features by templatizing your existing apps with a modular structure and the rhino package. At GSI Environmental, the need for a template arose as we continued to get requests for similar data viewer apps. Groundwater remediation and monitoring projects in particular all have the same need for interactive site maps, trend analysis, time series plotting, and the ability to explore data with various filters. Creating a template has allowed us to spend less time developing these apps, and more time on project-specific analysis. Modularity is the essential pre-requisite for an effective R Shiny template. This talk will provide a high-level guide to getting started with modularity and the rhino package structure for apps. In addition to frequently used modules and reactive values, styling and UI are also critical features of a template. I’ll show you how to organize all the pieces for maximum re-usability and easier debugging. While not strictly essential, standardized data management can make your template even more useful. With the environmental data we work with, most projects use a standardized data structure. This means that we can also re-use more of our data-handling code and templatize data-filtering reactive features that are specific to the data. The data viewer template that we’ve developed at GSI continues to evolve with styling updates, new modules, and improved reactivity flows. It serves as a central R Shiny codebase for the whole team. Our goal is to integrate our apps directly with our databases as our company evolves its data management strategy. This talk will share the lessons that we’ve learned and provide a quick-start guide to streamlining your app development with a modular template.
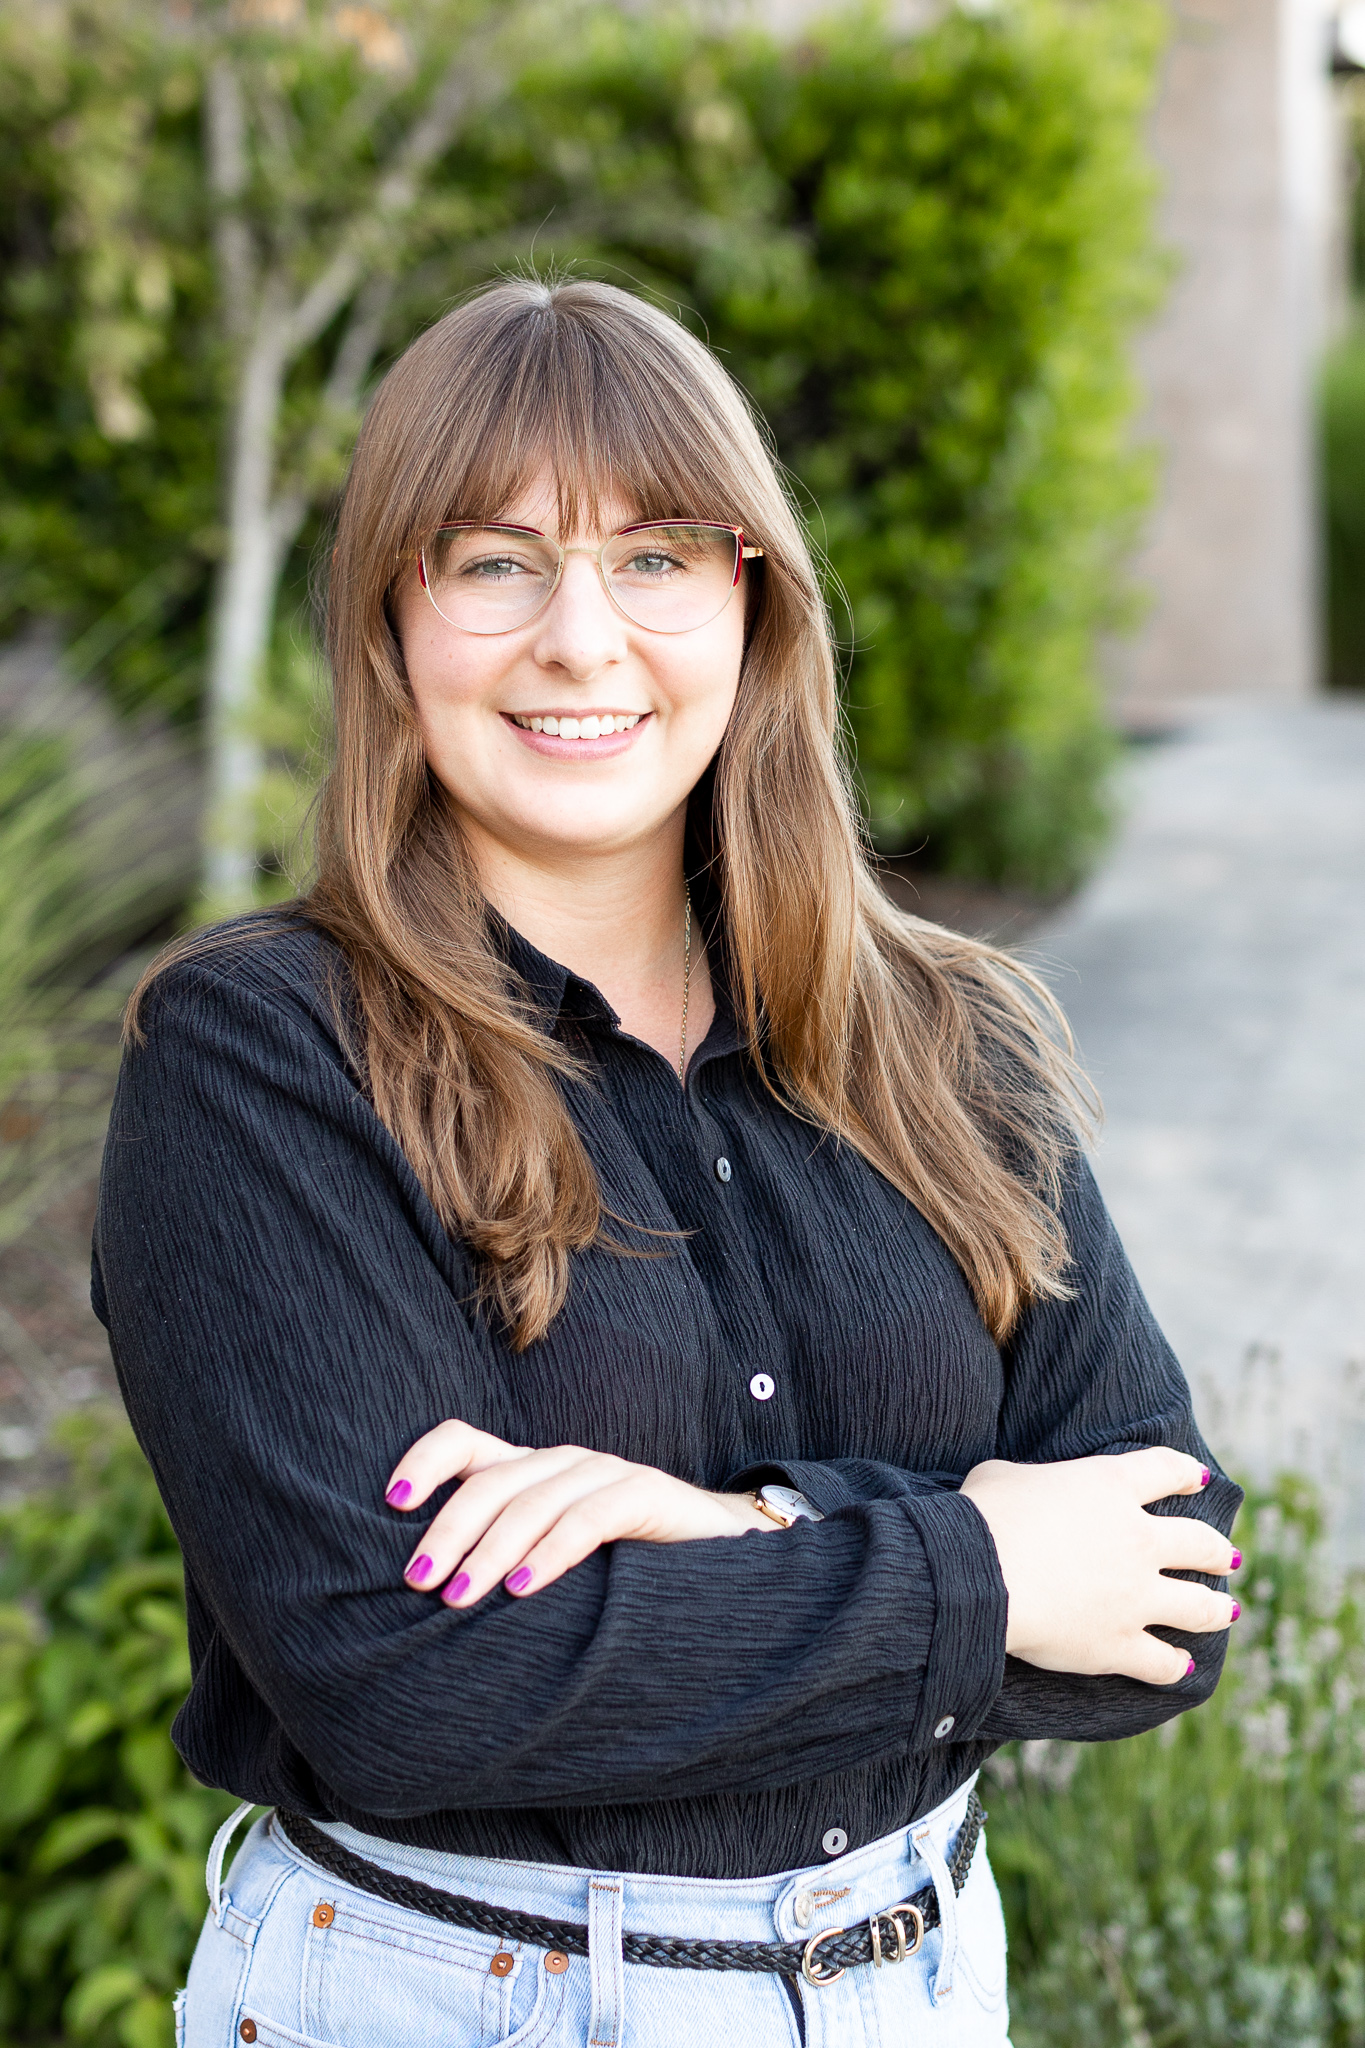 |
Pronouns: she/herOlympia, WAErica Bishop is an Environmental Data Scientist at GSI Environmental in Olympia, WA. She uses R for statistical analysis, data visualization, and Shiny App development to support a wide range of environmental monitoring, remediation, and risk assessment projects. She delights in translating the complexities of the environment into plots, maps, and apps. When Erica is not behind the computer, she enjoys reading fiction and mountain biking. |
Evan Landman
Developing reproducible transit analysis with R
Regular talk, 1:30 - 2:30 PM
Jarrett Walker & Associates (JWA) is a planning consulting firm that has led bus network design projects that shape the map of transit networks in major cities throughout the US from Portland to Miami Cleveland to Houston and many more in between.
Throughout all its projects JWA relies on R as the cornerstone of its analysis approach. Learn about how JWA has leveraged the GTFS and other transit data standards to apply technically complex analyses for transit agencies of all sizes. JWA has invested in building around the growing R transit package ecosystem developing its own packages and training its staff in the R skills needed to put it all into practice. This has enabled our company to reduce reliance on closed-sourced tools and put more control over our analysis in the hands of the people tasked with running it.
Some of the topics that will be discussed include: • Wrangling GTFS data. • Conducting advanced travel time and job access analysis. • Visualizing transit data. • Evaluating mobility and equity outcomes of new transit plans. • Designing repeatable workflows that can be quickly learned by people with different coding skills levels.
This presentation will serve both as an introduction into analyzing transit data in R as well as a window into how transit planning practitioners work in R in real-world settings including Portland.
 |
Pronouns: he/himPortland, OR, USAEvan Landman is a Principal Associate and head of research and development with Jarrett Walker & Associates, a transit planning consulting firm based in Portland, OR. JWA is a leader in transit network planning, analysis, cartography and public involvement, and has led planning for major transit network changes implemented in Portland, Houston, Miami, Dallas, Cleveland, Dublin, IE, and many other cities. |
Faycal Ounacer
Assessing the Impact of Coastal Upwelling on Fisheries: Insights from the California Current System
Lighting Talk, 2:30 - 2:55 PM
The EBUSs are among the most biologically productive ocean ecosystems in the world and provide more than 20% of the world catch of fish on <1% of the ocean surface. They include the California, Humboldt, Canary, and Benguela Current systems and provide critical ecosystem, economic, and recreational services for over 80 million people who either live along their coasts or near those coasts. This study deals with the analysis of relationships between the California Current System, coastal climatology, and fishing activity by adopting a climato-oceano-economic approach along the California coast. The study points out the phenomenon of upwelling within the California system, which have repercussions on peculiarities along the coast that impact marine resources and, hence, have implications for inhabitants of the coastal areas as well as for local economies. Data are from NOAA, chlorophyll, and sea surface temperature, while fisheries data were obtained from official reports. The analysis is then controlled using R and Python programming languages. In this work, one looks for evidence of relevance of the upwelling phenomenon for fisheries production but also forms strategies in the use of marine resources in a sustainable way.
 |
Pronouns: he/himCorvallis, OR, USAFaycal Ounacer is a Fulbright scholar and PhD candidate jointly enrolled at Ibn Zohr University in Morocco and Oregon State University. He holds a master's degree in environmental management and sustainable development. His research focuses on coastal climatology and the impact of upwelling on fisheries along the Moroccan coast. Faycal has represented Morocco in international dialogues, including the COP27 in Cairo, passionate about climate action, and science education as a peer educator for IRENA. |
Frank Aragona
Language Translation at Scale: Automating Bulk Document Translation with R and Quarto
Lighting Talk, 10:55 - 11:20 AM
Background:
Publishing software like RMarkdown or Quarto allow a user to automate and dynamically render all aspects of a document. For example, we can automatically re-render a file when there is new data available, and the figures and text will update to account for the new data. I expanded on these automated publishing capabilities and wrote a script that can translate the language of the document’s text. The script allows publishers to spend less time translating documents, while making reports available in more languages.
Methods:
The translation script uses R packages to parse text from a markdown file, apply a user-selected language model for translation, and then Quarto to convert the document back into a readable form. I used the lightparser R package to parse the text out of the markdown file, and a Hugging Face Transformers Helsinki language model to translate it into Spanish. Note that a user could import their own language model(s). The lightparser package was then used again to convert the translated text back into markdown, allowing Quarto to render the new document.
Results:
The script was tested using a Quarto markdown file containing code blocks and English text as the source. The lightparser package successfully parsed the text from the document, distinguishing code blocks from the English text. The script then applied the Helsinki language model to the text, translating it into Spanish while leaving the code blocks in English. This ensures that the code blocks remain executable, as they are not translated into a new language. Finally, Quarto successfully rendered the translated markdown file into HTML, PDF, and DOCX formats. The script can be adapted to ingest a source markdown file for translation and output it in multiple languages as specified by the user. Additionally, the entire process can be integrated into a job scheduler for fully automated processing.
Conclusion:
This script offers an automated solution for translating the content of Quarto or RMarkdown documents. The workflow can be adapted for bulk document translation, allowing users to seamlessly translate reports into multiple languages, formats, and parameters. This could significantly expand outreach to non-English-speaking communities, providing them with better access to information in their native language.
 |
Pronouns:Portland, OR, USAFrank Aragona is an Epidemiologist, Data Engineer, and Nerd. I like making cool things like home servers, cli tools, and data visuals. And Quarto has made me enjoy writing documentation. I'm also into reading (I love horror, history, politics, and anything else that is good), movies, hiking, language learning (human languages), and soccer. |
Hanna Winter
Introduce R to your other friends (or using R as a component in workflows)
Regular talk, 1:30 - 2:30 PM
R scripts are great tools to use as steps in simple and complex workflows. Why try to build a customized database output when you can take a standard output and use R to customize to your heart’s content? Just use R for data cleanup and reformatting as you prep data for a database or to feed into a model. Combine automated QC and human QC in workflows to get the best of both worlds. Let each of your tools do what it does best. This presentation will cover a couple examples of R being friends with databases GIS humans Excel and even (gasp!) Python. Use simple R scripts to help speed up routine workflows like prepping data to load to databases or aggregating database outputs for reporting. Compile and combine timeseries datasets reference datasets and discrete sample data to automate the tedious data processing and QA/QC steps but leave the visual interpretation and fine-tuning to the human. Write custom functions to calculate floodplain widths that plug into GIS models by letting R hold hands with ArcGIS. Let all your tools shine and join the party!
 |
Pronouns: she/herBellingham, WA, USAHanna Winter is an Environmental Data Scientist at Geosyntec Consultants in Bellingham, WA, where she uses R for data wrangling, data visualization, and statistical analysis for water resources and environmental remediation projects. She enjoys speeding up the pipeline from data gathering to decision making using R and developing scripted solutions to repetitive tasks for data management. |
Intermediate GIS and Mapping in R Workshop
Friday June 26, 2026
1:30 - 4:30 PM
Karl Miller Center, 615 SW Harrison Street, Portland, OR
Room KMC TBD
In this workshop, you will build on existing knowledge of GIS and mapping in R to tackle more advanced problems, including raster and geospatial feature analysis and the creation of interactive web maps using leaflet. Topics include using terra to analyze raster data (e.g., time series, spatial pattern analyses, point extraction, and spatial statistics) and using sf to join and analyze vector data. Both raster and vector datasets will be incorporated into leaflet maps to visualize different types of geographic information based on their underlying data structures.
Knowledge Prerequisites: A basic understanding of the terra and sf packages is recommended.
Pre-Installations: A recent version of R and RStudio and the following packages: dplyr, ggplot2, patchwork, viridis, knitr, terra, sf, Kendall, leaflet, leaflet.extras, usaboundaries, httr
Instructor

Brittany Barker
Pronouns: She/her/hers
Location: Portland, Oregon / Corvallis, Oregon
Brittany Barker an Assistant Professor (Senior Research) at the Oregon IPM Center and Department of Horticulture at Oregon State University. She develops ecological models in R to provide decision-support for managing and monitoring invasive pests, their crop hosts, and their natural enemies. Over the past 10 years, she has transitioned from ArcGIS to R for nearly all GIS and mapping operations. She loves nature, running, native plants, wildlife, and sci-fi and horror books. You can learn more about Brittany’s research program here.
Intermediate GitHub for R Users
Friday June 20, 2025
1:30 - 4:30 PM
Karl Miller Center, 615 SW Harrison Street, Portland, OR
Room KMC 460
Learn intermediate GitHub skills including R code and package deployment, building a quarto website in GitHub for your project, and automating publishing workflow tasks with basic GitHub Actions.
Instructor

Skyler Elmstrom
Pronouns: He/him/his
Location: Everett, Washington
Skyler started his career in the United States Marine Corps where he specialized in geospatial intelligence (GEOINT), terrain analysis, and geodetic surveying. After his service in the military, he studied environmental science, GIS, statistics, and data science. Skyler's skills continue to take him across disciplines where his knowledge and experience are broadly applicable. He believes leadership should happen at all levels, be transparent, foster innovation, and support the equitable advancement of those around you.
Learn more at skylere.com.
Intermediate GitHub: Practical Publishing with GitHub and Quarto Workshop
Friday June 26, 2026
1:30 - 4:30 PM
Karl Miller Center, 615 SW Harrison Street, Portland, OR
Room KMC TBD
This intermediate GitHub workshop is for participants who already know the basics and want to apply them to something real. Attendees will build a personal website using Quarto, manage content using GitHub branches and pull requests, and deploy the site automatically with GitHub Pages. The workshop introduces GitHub Actions through the Marketplace, focusing on adapting existing automations rather than writing complex workflows from scratch. Participants will leave with a working site and a reusable publishing pattern they can apply to documentation, portfolios, or project sites.
Knowledge Prerequisites: Basic familiarity with GitHub concepts such as repositories, branches, and pull requests. Prior experience with R or Markdown is helpful but not required.
Pre-Installations: A recent version of RStudio, Positron, or VS Code; a recent version of R; Git installed locally; and a GitHub account. The instructor will demonstrate Git operations using the GitHub Desktop app, but participants may use their preferred Git interface.
Instructor

Skyler Elmstrom
Pronouns: He/him/his
Location: Everett, Washington
Skyler Elmstrom is a Public Health Data Science and Informatics Specialist at the Washington State Department of Health. His work focuses on modern, reproducible analytics workflows using GitHub, Quarto, R, Python, and cloud platforms. He regularly teaches GitHub and documentation workflows to analysts and researchers across public-sector and academic settings, with an emphasis on practical skills people can immediately reuse.
Intermediate Quarto: Parameterized Reports Workshop
Friday June 21, 2024
1:30 - 4:30 PM
Room C123A
The Intro Quarto workshop takes you through the basics of authoring a reproducible report using Quarto. This workshop builds on those concepts and teaches you how to level up your reproducible reports by using parameters, conditional content, conditional code execution, and custom styling sheets for HTML and Microsoft Word formats. Additionally, you will learn how to render all variations of a parameterized report at once using quarto and purrr.
Knowledge Prerequisites: The workshop is designed for those with some experience in R and R Markdown or Quarto. It will be assumed that participants can perform basic data manipulation and visualization. Experience with the tidyverse, especially purrr and the pipe operator, is a major plus, but is not required.
Pre-Installations: Recent version of R, RStudio, and Quarto CLI. Packages used in exercises include dplyr, fs, ggplot2, here, janitor, knitr, lubridate, plotly, purrr, quarto, readr, rmarkdown, stringr, and tidyr.
install.packages(c("dplyr", "fs", "ggplot2", "here", "janitor", "knitr",
                   "lubridate", "plotly", "purrr", "quarto", "readr",
                   "rmarkdown", "stringr", "tidyr"))
Instructor
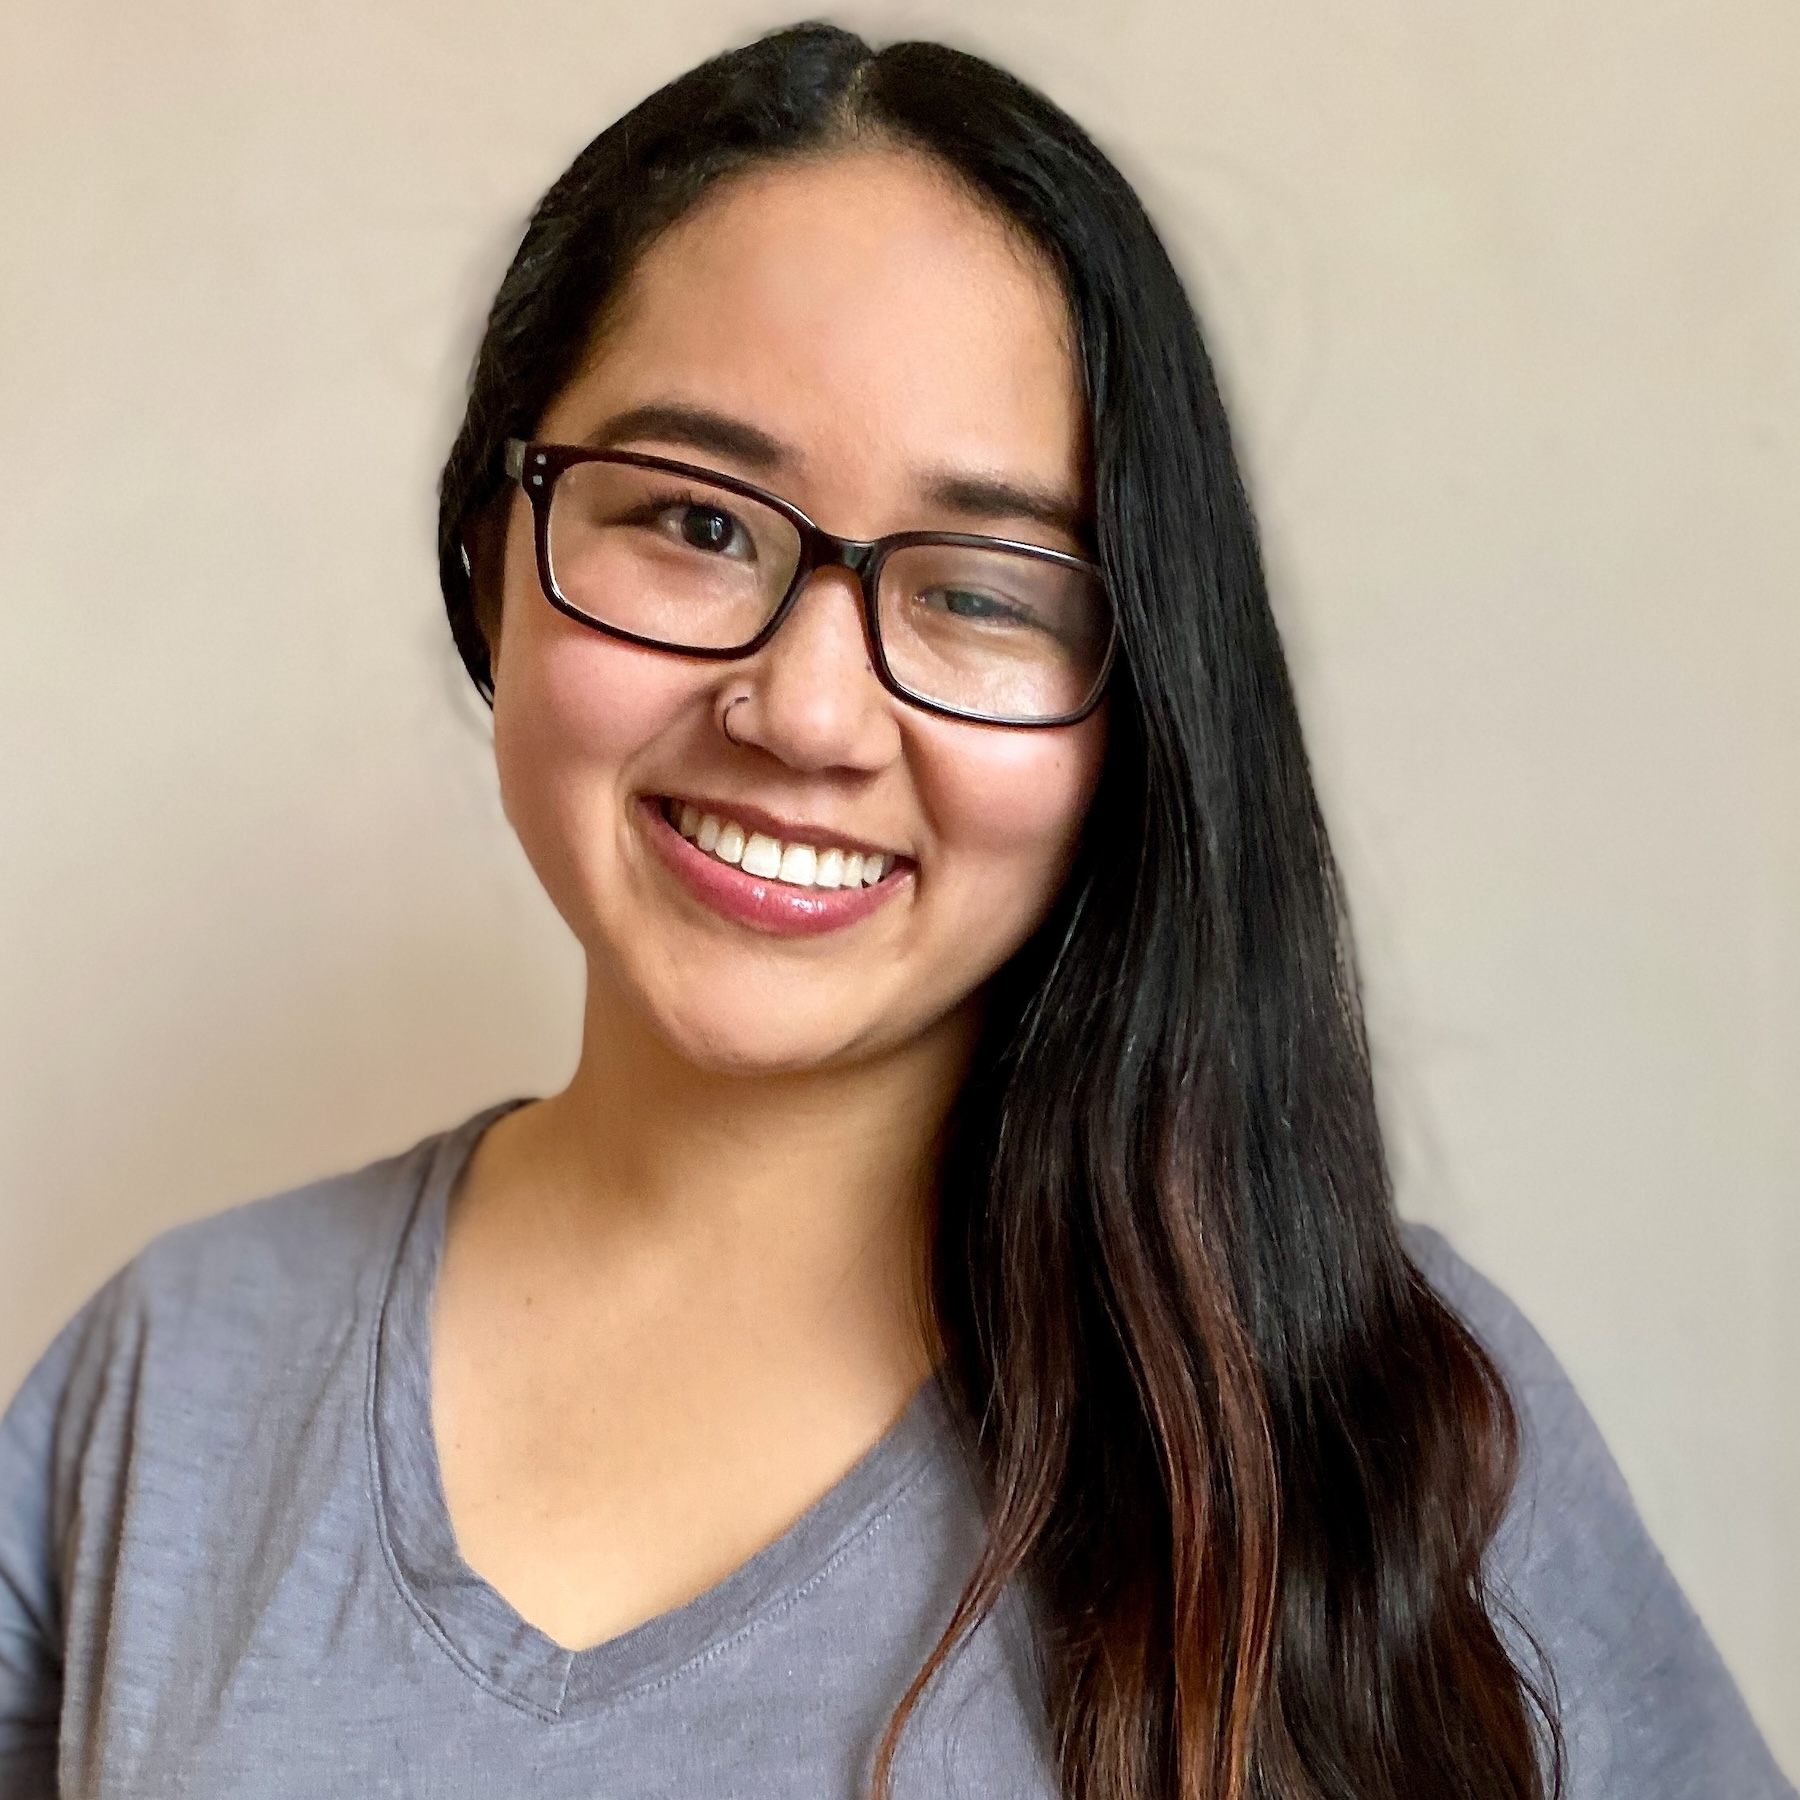
Jadey Ryan
Pronouns: She/her/hers
Location: Tacoma, Washington
Jadey Ryan is a self-taught R enthusiast working in environmental data science in the Natural Resources and Agricultural Sciences section of the Washington State Department of Agriculture. She is obsessed with cats, nature, R, and Quarto.
Learn more at jadeyryan.com.
Intermediate Shiny Workshop
Friday June 20, 2025
9:00 AM - 12:00 PM
Karl Miller Center, 615 SW Harrison Street, Portland, OR
Room KMC 180
Build on your beginning shiny skills and learn more about the confusing parts of shiny, and the surrounding shiny ecosystem. By the end of this workshop, you will be able to:
- Dynamically update controls based on other inputs
- Explain when to use
eventReactiveversusobserveEventin your code - Use Quarto Dashboards with Shiny
- Utilize Modules in your Shiny Application
Knowledge Prerequisites: Basic knowledge of shiny apps. If you know how to build this app - Single File Shiny App, you should be good to go.
Pre-Installations: We will use Posit.Cloud for this workshop, so no installations needed.
Instructor

Ted Laderas
Pronouns: He/him/his
Location: Portland, Oregon
Ted Laderas is a trainer, instructor, and community builder. He currently works at the Fred Hutch Cancer Center managing the data science community. He love Shiny, but acknowledges there are some confusing parts.
Intermediate Shiny Workshop
Friday June 26, 2026
9:00 AM - 12:00 PM
Karl Miller Center, 615 SW Harrison Street, Portland, OR
Room KMC TBD
Build on your beginning shiny skills and learn more about the confusing parts of shiny, and the surrounding shiny ecosystem. By the end of this workshop, you will be able to:
- Dynamically update controls based on other inputs
- Explain when to use
eventReactiveversusobserveEventin your code - Use Quarto Dashboards with Shiny
- Utilize Modules in your Shiny Application
- Utilize
shinychatto add chatbots to your Shiny Application
Knowledge Prerequisites: Basic knowledge of shiny apps. If you know how to build this app - Single File Shiny App, you should be good to go.
Pre-Installations: A recent version of R, RStudio, and the shiny package.
Instructor

Ted Laderas
Pronouns: He/him/his
Location: Portland, Oregon
Ted Laderas is a trainer, instructor, and community builder. He currently works at the Fred Hutch Cancer Center managing the data science community. He love Shiny, but acknowledges there are some confusing parts.
Intermediate Shiny: How to Draw the Owl Workshop
Friday June 21, 2024
9:00 AM - 12:00 PM
Room C123B
Build on your beginning shiny skills and learn more about the confusing parts of shiny, and the surrounding shiny ecosystem. By the end of this workshop, you will be able to:
-
Dynamically update controls based on other inputs
-
Explain when to use eventReactive versus observeEvent in your code
-
Use Quarto Dashboards with Shiny
-
Integrate ObservableJS visualizations into your Shiny Applications
-
Explain the deployment process to Shinyapps.io and Posit Connect
Knowledge Prerequisites: Basic knowledge of shiny apps. If you know how to build this app - Single File Shiny App, you should be good to go.
Pre-Installations: We will use Posit.Cloud for this workshop, so no installations needed.
Instructor

Ted Laderas
Pronouns: He/him/his
Location: Portland, Oregon
Ted Laderas is a trainer, instructor, and community builder. He currently works at the Fred Hutch Cancer Center managing the data science community. He love Shiny, but acknowledges there are some confusing parts.
Intro GitHub for R Users Workshop
Friday June 20, 2025
9:00 AM - 12:00 PM
Karl Miller Center, 615 SW Harrison Street, Portland, OR
Room KMC 460
Learn the basics of using GitHub for improved R reproducibility, portability, defensibility, and more with a brief introduction to GitHub version control with the GitHub Flow, integrating GitHub with your R development environment and projects, and thoughtful individual and collaboration best practices.
Instructor

Skyler Elmstrom
Pronouns: He/him/his
Location: Everett, Washington
Skyler started his career in the United States Marine Corps where he specialized in geospatial intelligence (GEOINT), terrain analysis, and geodetic surveying. After his service in the military, he studied environmental science, GIS, statistics, and data science. Skyler's skills continue to take him across disciplines where his knowledge and experience are broadly applicable. He believes leadership should happen at all levels, be transparent, foster innovation, and support the equitable advancement of those around you.
Learn more at skylere.com.
Intro to Positron for R/RStudio Users Workshop
Friday June 20, 2025
1:30 - 4:30 PM
Karl Miller Center, 615 SW Harrison Street, Portland, OR
Room KMC 185
Come try Positron, the next-generation data science IDE from Posit. Explore its advanced features and get tips for transitioning your workflow from RStudio.
Knowledge Prerequisites: You should have some prior experience in R and RStudio, but no specific experience in any packages is required.
Pre-Installations: Positron IDE
Instructor
Charlotte Wickham
Pronouns: She/her/hers
Location: Corvallis, Oregon
Charlotte Wickham is a Developer Educator at Posit with a focus on Quarto. Before Posit, she taught Statistics and Data Science at Oregon State University.
Intro to Rust for R Developers Workshop
Friday June 20, 2025
9:00 AM - 12:00 PM
Karl Miller Center, 615 SW Harrison Street, Portland, OR
Room KMC 465
In this workshop, participants will learn the foundations of the Rust programming language with a specific focus on building Rust-based R packages. The curriculum offers an opinionated selection of topics that allows R developers to draw parallels with their existing programming knowledge. We begin with fundamental concepts such as built-in types and variable mutability, then progress to more complex topics including collections, loops, and iterators. The workshop also covers creating custom types with structs, handling missingness with Option, and error handling with Results.
Knowledge Prerequisites: This workshop is tailored towards intermediate R programmers (or of any language). Participants must be familiar with fundamental computing concepts such as:
- Data types such as floats, integers, and booleans.
- Iteration such as for / while loops,
purrr::map()style iterators, and theapply()family of functions - Control Flow
- Writing functions
Instructor

Josiah Parry
Pronouns: He/him/his
Location: Seattle, Washington
Josiah Parry believes R belongs in production. He has a penchant for writing R packages that are really fast and efficient. Typically, this involves writing Rust and glueing R them together using extendr. He also, quite specifically, likes solving geospatial problems. He works at Esri doing spatial statistics and —you guessed it— writing R packages.
Learn more at josiahparry.com.
Introduction to GIS and Mapping in R Workshop
Friday June 26, 2025
9:00 AM - 12:00 PM
Karl Miller Center, 615 SW Harrison Street, Portland, OR
Room KMC TBD
The usage of R in GIS is growing because of its enhanced capabilities for statistics, data visualization, and spatial analytics. In this workshop, you will learn some basics of working with geospatial data and producing maps in R. Topics will include using sf and terra to work with vector and raster data, respectively. You will practice visualizing geospatial data using base plotting functions and ggplot2.
Knowledge Prerequisites: Though not required, it would be beneficial to know some basics of using dplyr and ggplot2.
Pre-Installations: A recent version of RStudio and the following R packages: dplyr, ggplot2, patchwork, viridis, knitr, terra, sf, usaboundaries, httr
Instructor

Brittany Barker
Pronouns: She/her/hers
Location: Portland, Oregon / Corvallis, Oregon
Brittany Barker an Assistant Professor (Senior Research) at the Oregon IPM Center and Department of Horticulture at Oregon State University. She develops ecological models in R to provide decision-support for managing and monitoring invasive pests, their crop hosts, and their natural enemies. Over the past 10 years, she has transitioned from ArcGIS to R for nearly all GIS and mapping operations. She loves nature, running, native plants, wildlife, and sci-fi and horror books. You can learn more about Brittany’s research program here.
Introduction to GIS and mapping in R Workshop
Friday June 21, 2024
1:30 - 4:30 PM
Room C123B
The usage of R in GIS is growing because of its enhanced capabilities for statistics, data visualization, and spatial analytics. In this workshop, you will learn some basics of working with geospatial data and producing maps in R. Topics will include using sf and terra to work with vector and raster data, respectively. You will practice visualizing geospatial data using base plotting functions, ggplot2, and leaflet.
Knowledge Prerequisites: Though not required, it would be beneficial to know some basics of using dplyr and ggplot2.
Pre-Installations: dplyr, ggplot2, patchwork, viridis, knitr, terra, sf, leaflet, usaboundaries, and httr
install.packages(c("dplyr","ggplot2","patchwork","viridis","knitr",
                   "terra","sf","leaflet","httr"),
                   Ncpus = 3)
install.packages("remotes")
remotes::install_github("ropensci/USAboundaries")
remotes::install_github("ropensci/USAboundariesData")
Instructors
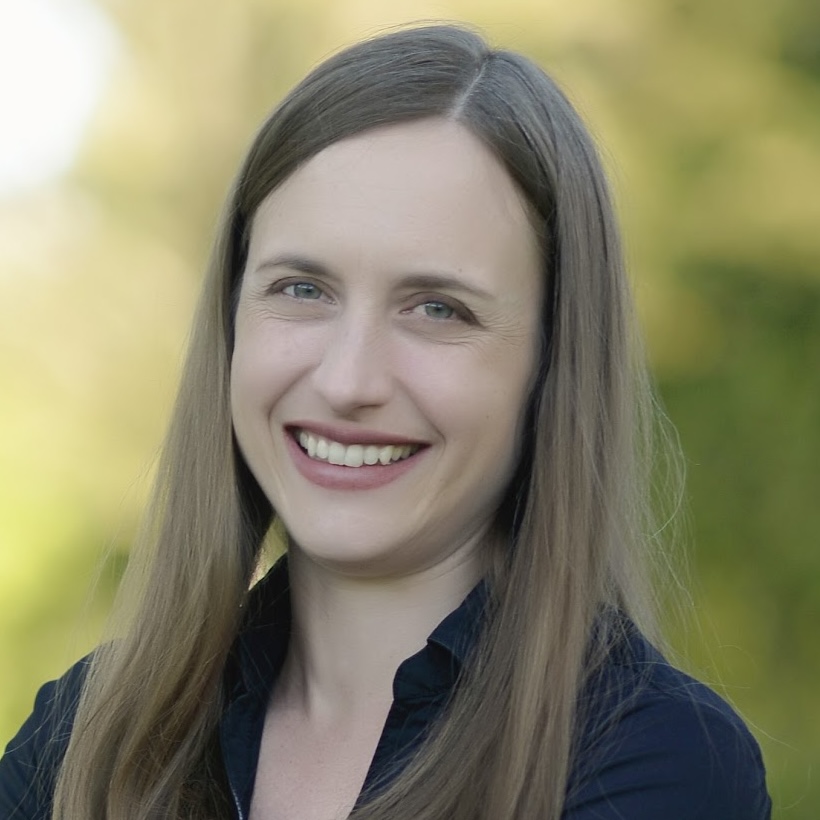
Brittany Barker
Pronouns: She/her/hers
Location: Portland, Oregon
Brittany Barker is an Assistant Professor (Senior Research) at the Oregon IPM Center at Oregon State University. She uses R to develop ecological models that can provide decision-support for managing and monitoring pests, their crop hosts, and their natural enemies. Over the past five years, she has transitioned from ArcGIS to R for nearly all GIS and mapping operations. She loves nature, running, native plants, wildlife, and sci-fi and horror books.

Roger Andre
Pronouns: He/him/his
Location: Seattle, Washington
Roger is Sr. Business Analysis Manager at T-Mobile. He has used R for location based analyses of retail store locations and for reporting and dashboard generation (and a whole lot of data wrangling). His background is in code-first spatial data analysis and engineering. When not on a computer, he enjoys fly-fishing and reading.
Introduction to GIS and mapping in R Workshop
Friday June 20, 2025
1:30 - 4:30 PM
Karl Miller Center, 615 SW Harrison Street, Portland, OR
Room KMC 180
The usage of R in GIS is growing because of its enhanced capabilities for statistics, data visualization, and spatial analytics. In this workshop, you will learn some basics of working with geospatial data and producing maps in R. Topics will include using sf and terra to work with vector and raster data, respectively. You will practice visualizing geospatial data using base plotting functions, ggplot2, and leaflet.
Knowledge Prerequisites: Though not required, it would be beneficial to know some basics of using dplyr and ggplot2.
Pre-Installations: dplyr, ggplot2, patchwork, viridis, knitr, terra, sf, leaflet, usaboundaries, and httr
install.packages(c("dplyr","ggplot2","patchwork","viridis","knitr",
                   "terra","sf","leaflet","httr"),
                   Ncpus = 3)
install.packages("remotes")
remotes::install_github("ropensci/USAboundaries")
remotes::install_github("ropensci/USAboundariesData")
Instructors

Brittany Barker
Pronouns: She/her/hers
Location: Portland, Oregon
Brittany Barker is an Assistant Professor (Senior Research) at the Oregon IPM Center at Oregon State University. She uses R to develop ecological models that can provide decision-support for managing and monitoring pests, their crop hosts, and their natural enemies. Over the past five years, she has transitioned from ArcGIS to R for nearly all GIS and mapping operations. She loves nature, running, native plants, wildlife, and sci-fi and horror books.
Carrie Preston
Pronouns: She/her/they/them
Location: Corvallis, Oregon
Carrie Preston is a Research Associate at the Oregon IPM Center at Oregon State University. She is using R to understand how climate and other factors influence the population dynamics of beneficial insects that attack invasive species. As an entomologist, Carrie enjoys capturing insects for her collection, and as a New York State native, the opportunity to collect specimens on the West Coast could not be beat! She also enjoys photography, dungeons and dragons, rearing praying mantises and jumping spiders, gardening, and walking her cats.
Introduction to GitHub: Collaboration Basics for R Users Workshop
Friday June 26, 2026
9:00 AM - 12:00 PM
Karl Miller Center, 615 SW Harrison Street, Portland, OR
Room KMC TBD
This beginner-friendly workshop introduces GitHub through hands-on, low-pressure collaboration rather than lectures about version control. Participants will contribute content to a shared “community cookbook,” open and review pull requests, and see their work appear on a live, published site. The session is designed to be fun, social, and practical—expect light chaos, friendly reviews, and a clear sense of how GitHub turns individual edits into shared outcomes. No command-line Git required.
Knowledge Prerequisites: Create a GitHub account at www.github.com and set up 2FA, if you have not already. No prior GitHub experience required. Familiarity with R or Markdown is helpful but not necessary.
Instructor

Skyler Elmstrom
Pronouns: He/him/his
Location: Everett, Washington
Skyler Elmstrom is a Public Health Data Science and Informatics Specialist at the Washington State Department of Health. His work focuses on modern, reproducible analytics workflows using GitHub, Quarto, R, Python, and cloud platforms. He regularly teaches GitHub and documentation workflows to analysts and researchers across public-sector and academic settings, with an emphasis on practical skills people can immediately reuse.
Introduction to Quarto Workshop
Friday June 21, 2024
9:00 AM - 12:00 PM
Room C123A
Quarto is a publishing system for weaving together code and narrative to create fully reproducible documents, presentations, websites, and more. In this workshop, you’ll learn what you need to start authoring Quarto documents in RStudio. You do not need any prior experience with R Markdown, but if you have some, you’ll also get a few tips for transitioning to Quarto.
Knowledge Prerequisites: You should be comfortable opening, editing and navigating files in RStudio. You should have some experience with the R language, but no specific experience in any packages is required.
Pre-Installations: Recent version of R, RStudio, and Quarto CLI. R packages: tidyverse, gt, palmerpenguins, quarto. Detailed instructions provided prior to the workshop.
install.packages(c("tidyverse", "gt", "palmerpenguins", "quarto"))
Instructor

Charlotte Wickham
Pronouns: She/her/hers
Location: Corvallis, Oregon
Charlotte Wickham is a Developer Educator at Posit with a focus on Quarto. Before Posit, she taught Statistics and Data Science at Oregon State University.
Isabella Velásquez
The medium is the message: R programmers as content creators
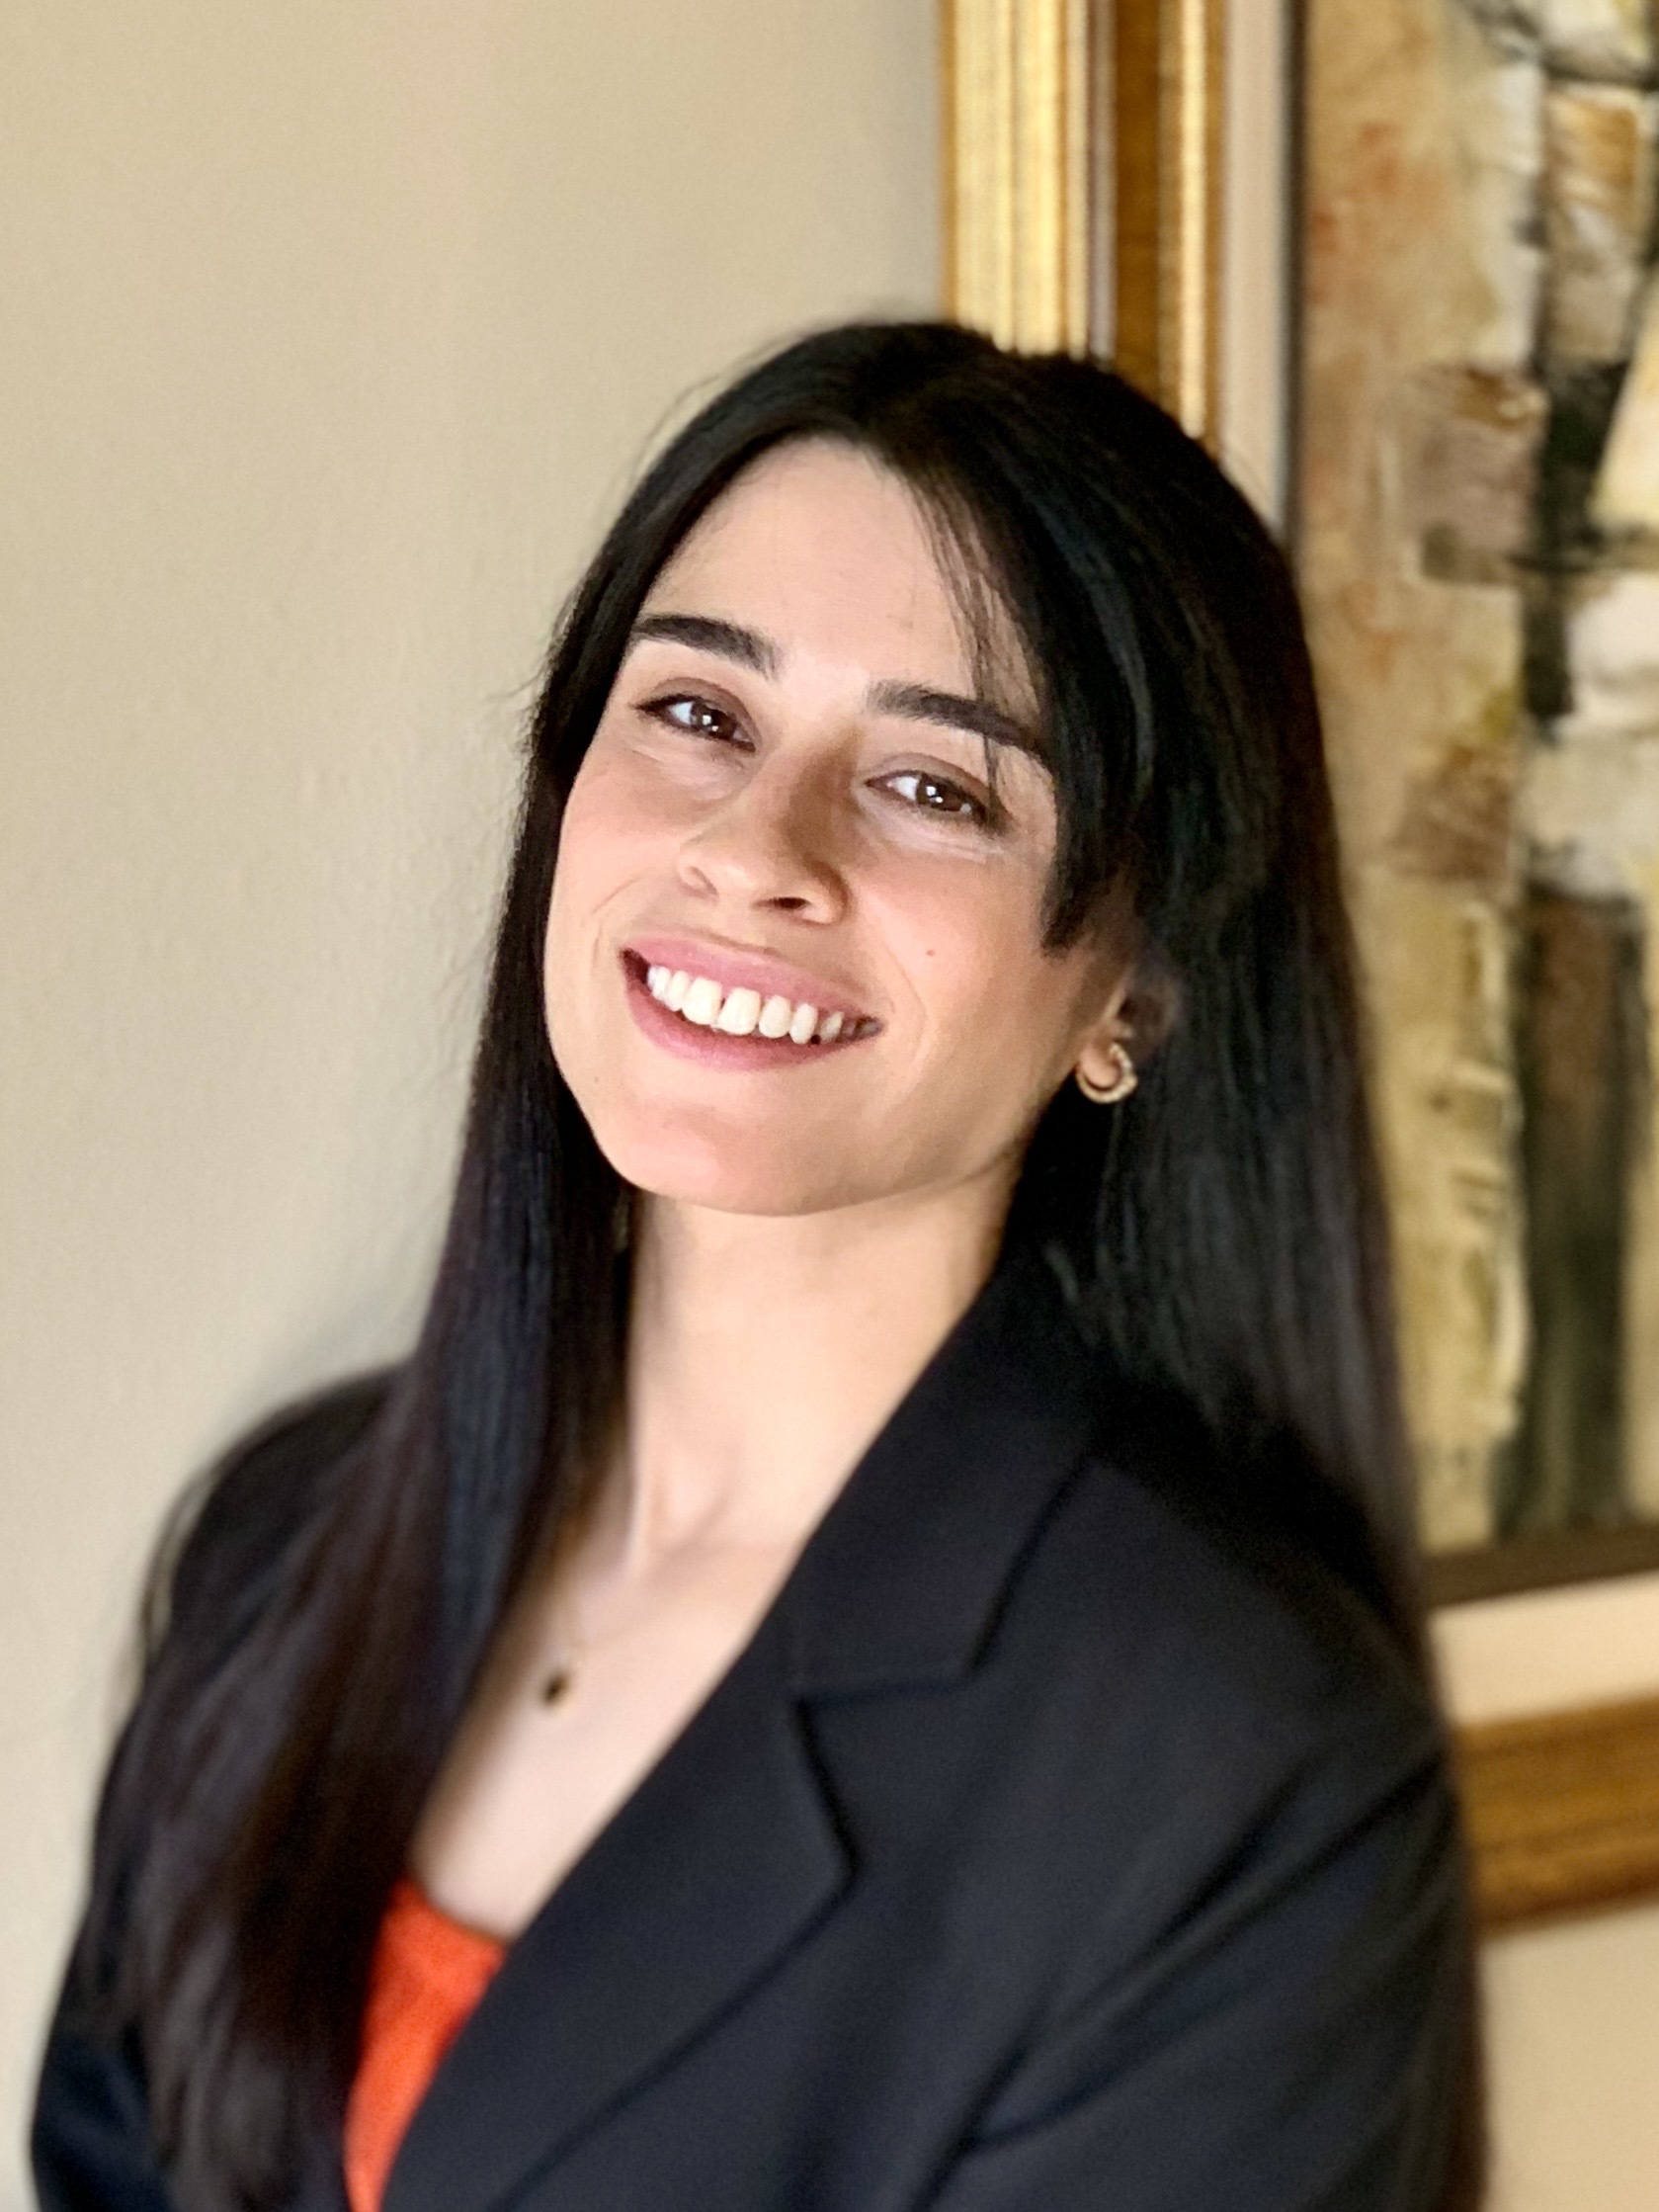 |
Pronouns: she/herSeattle, WA, USAIsabella is an R enthusiast, first learning the programming language during her MSc in Analytics. Previously, Isabella conducted data analysis and research, developed infrastructure to support use of data, and created resources and trainings. Her work on the Posit (formerly RStudio) Marketing team draws on these experiences to create content that supports and strengthens data science teams. In her spare time, Isabella enjoys playing with her tortoiseshell cat, watching film analysis videos, and hiking in the mountains around Seattle. Find her on Twitter and Mastodon: @ivelasq3 |
Jacqueline Nolis
Docker for R users: run your code in the cloud
Regular talk, 3:30-3:45
 |
Pronouns: she/herSeattle, WADr. Jacqueline Nolis is a data science leader with over 15 years of experience in managing data science teams and projects at companies ranging from DSW to Airbnb. Jacqueline has a PhD in Industrial Engineering and coauthored the book Build a Career in Data Science. For fun, she likes to use data science for humor—like using deep learning to generate offensive license plates. |
Jadey Ryan
Using Shiny to optimize the climate benefits of a statewide agricultural grant program
Washington’s Sustainable Farms and Fields program provides grants to growers to increase soil carbon or reduce greenhouse gas (GHG) emissions on their farms. To optimize the climate benefits of the program, we developed the Washington Climate Smart Estimator {WaCSE} using R and Shiny.
Integrating national climate models and datasets, this intuitive, regionally specific user interface allows farmers and policymakers to compare the climate benefits of different agricultural practices across Washington’s diverse counties and farm sizes. Users can explore GHG estimates in interactive tables and plots, download results in spreadsheets and figures, and generate PDF reports. In this talk, we present the development process of {WaCSE} and discuss the lessons we learned from creating our first ever Shiny app.
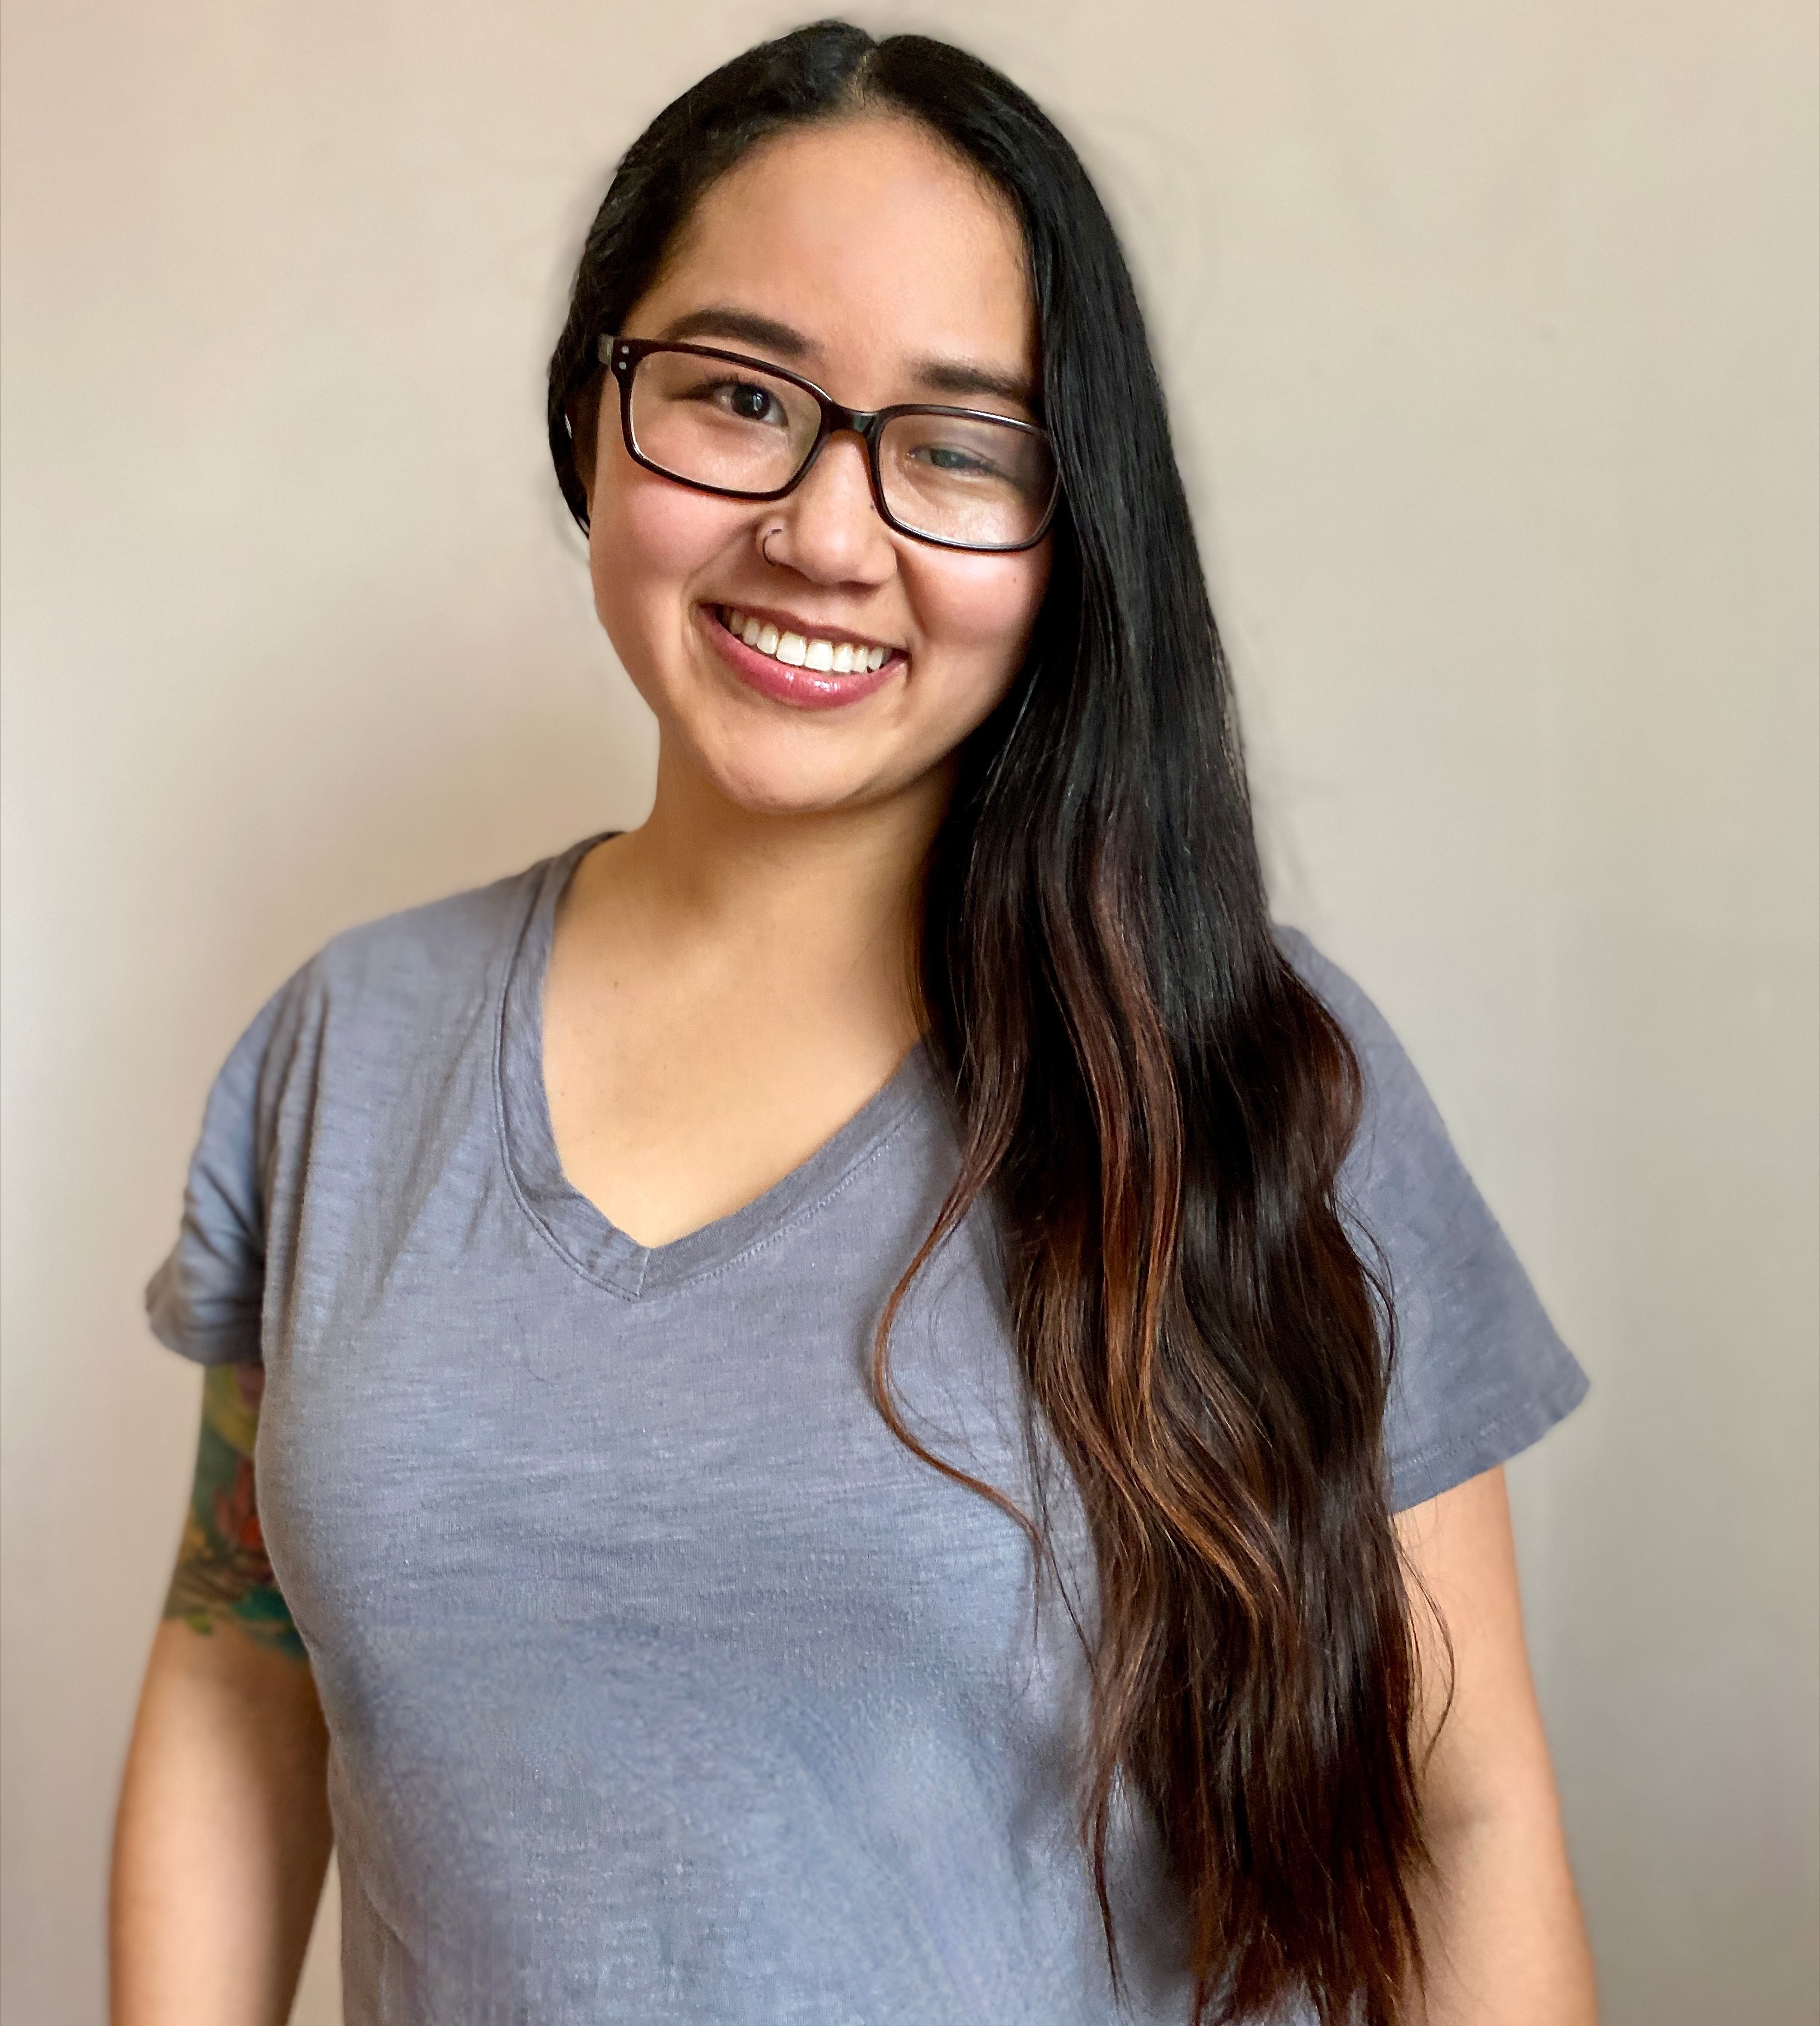 |
Pronouns: she/herSeattle, WA, USAJadey Ryan works for the Washington State Department of Agriculture in the Natural Resources Assessment Section. She supports the Washington Soil Health Initiative and Sustainable Farms and Fields programs by collecting and processing soil and climate data, managing the soil health database, and developing tools to visualize and analyze the data. These data products contribute sound science to inform decision making that balances healthy land with sustained ecosystem functions with a thriving agricultural economy. Jadey primarily uses R in her day-to-day and considers herself a self-taught intermediate user. |
Joe Roberts
Taking CRAN to the Next Level with Posit Public Package Manager
Lighting Talk, 1:30-1:35
Everyone working in R downloads and installs packages from CRAN to help them build cool things, but most don't even think about where those packages are coming from because “it just works.” Posit (the company that brings you RStudio) also provides a free service to the R community that makes working with CRAN packages even easier. In this talk, we'll learn what Posit Public Package Manager is, what extra features and advantages it provides over standard CRAN mirrors, and how easy it is to change your default R repository and start using it.
 |
Pronouns: he/himSeattle, WAJoe is a Product Manager at Posit focused on R and Python package management for teams. He has a background in software engineering, and has spent his entire career developing enterprise data analysis software and tools for data scientists. He's passionate about finding ways to make it easier for everyone to develop, share, and use packages across any organization, large or small. |
Jonathan McPherson
10 Years of RStudio and What Happens Next
Regular talk, 11:20 AM - 12:20 PM
RStudio is one of the most popular IDEs for data science ever made. In this talk I'll reflect on the last decade of its development and the principles that guided its journey. What makes data science IDEs different from other development environments? We'll get into the philosophy of tool use just a little bit – how the tools we use shape the things we make. I'll share some thoughts about what's coming in the next decade of data science tooling from Posit.
In an effort to make the talk at least marginally practical I'll also talk about R in Posit's new IDE Positron and share some tips and tricks for customizing and extending its R experience.
 |
Pronouns: he/himKirkland, WA, USAJonathan McPherson is a software architect at Posit Software, PBC, working primarily on the Positron IDE. In the past, he's worked on the RStudio IDE at Posit, Office at Microsoft, and web applications at a nuclear site in the desert. |
Justin Sherrill
Transit Access Analysis in R
Transit agencies across the country are facing a fiscal cliff that threatens their ability to provide vital services to cities and communities. Understanding the crucial role of these networks in creating livable cities is now more important than ever. This presentation offers an intermediate-level overview of R packages and workflows for analyzing public transit networks and assessing their connectivity to amenities such as jobs, schools, parks, and stores. It showcases how to report results and outlines the necessary data inputs for this analysis. Packages like {tidytransit} enable users to access transit schedule data in the General Transit Feed Specification (GTFS) format, allowing them to map stops, routes, and calculate service frequency. Going deeper, packages like {r5r} combine GTFS files with OpenStreetMap street network data to model origin-destination trips based on factors like time of day, walking speed, and transfer preferences. This presentation demonstrates that these packages, alongside other essential {tidyverse} tools, empower R users with powerful resources to delve into the realm of transit planning and modern urban analytics.
 |
Pronouns: he/himPortland, OR, USAJustin Sherrill is a Technical Manager with regional planning & economics consulting firm ECONorthwest. His work focuses primarily on demographics, transport systems analysis, the socioeconomics of land use policies, and effective data visualization.Prior to joining ECONorthwest, Justin worked at the Population Research Center at Portland State University, helping vet early results from the 2020 Census, and at King County Metro, where he supported the agency's Strategy & Performance team in tracking operational efficiency, prioritizing transit-related capital projects, and building interactive dashboards. Outside of his work at ECONorthwest, you can find published examples of Justin's maps and data visualizations in Proceedings of the National Academy of Sciences, and in “Upper Left Cities: A Cultural Atlas of San Francisco, Portland, and Seattle”. |
Justin Sherrill
Cartographic Tricks & Techniques in R
Regular talk, 11:25-11:40
Over the past few years, the R-spatial community has leveraged the flexibility and popularity of R to create some truly powerful spatial analytics and cartographic packages. This presentation intends to provide a general overview of the packages, functions, and best practices for mapping in R. Example topics to be discussed will range from labeling geographic features and inserting basemaps in {ggplot2}, to repairing and simplifying geometries, to making quick yet effective interactive maps in {mapview} or {leaflet}. The intended audience is expected to already be familiar with working with simple features in R through the {sf} package and how to build a basic plot with {ggplot2}, but curious about stepping up their cartographic game.
 |
Pronouns: he/himPortland, ORJustin Sherrill is a lead technical analyst at regional economics and planning consultant ECOnorthwest. Building on a education and professional background in urban planning and GIS, Justin now uses R on a daily basis to model housing markets and land use impacts for client governments across the Western US. Outside of his work at ECOnorthwest, you can find published examples of Justin’s maps and data visualizations in Proceedings of the National Academy of Sciences, and in Upper Left Cities: A Cultural Atlas of San Francisco, Portland, and Seattle. |
Kangjie Zhang
Beyond the Comfort Zone: Traditional Statistical Programmers Embrace R to Expand their Toolkits
In the pharmaceutical industry, traditional statistical programmers have long relied on proprietary software to perform data analysis tasks. However, in recent years, there has been a growing interest in open-source tools like R, which offer a range of benefits including flexibility, reproducibility, and cost-effectiveness.
In this presentation, we will explore the ways in which statistical programmers in the pharmaceutical industry are embracing R to expand their toolkits and improve their workflows, including data visualization and the generation of Analysis Data Model (ADaM) datasets.
One key challenge in using R to generate ADaM is bridging the gap between open-source R packages (e.g., admiral, metacore, metatools, xportr from Pharmaverse) and the company's internal resources. We will discuss strategies for overcoming this challenge and how it can be integrated into a company's existing infrastructure, e.g., including the development of in-house R packages and provide internal template scripts/use cases.
Overall, this presentation will provide examples of how R can be used as a powerful complement to traditional statistical programming languages, such as SAS. By embracing R, statistical programmers can expand their toolkits, collaborate across the industry to tackle common issues, and most importantly, provide value to their organizations/industry.
 |
Pronouns: she/herVancouver, BC, CanadaKangjie Zhang is a Lead Statistical Analyst at Bayer within Oncology Data Analytics team. She uses SAS and R for statistical analysis and reporting, supporting clinical trial studies and facilitating the transition from SAS to R for clinical submissions. With a passion for open-source projects, she has contributed to multiple R packages. Before joining the pharma industry, she worked as a Data Analyst at CHASR ([Canadian Hub for Applied and Social Research](https://chasr.usask.ca/index.php)) and the Saskatoon Police Station, utilizing R for data collection, manipulation, and predictive modeling. |
Ken Vu
Drawing a Christmas card with the ggplot2 package
Regular talk, 11:40-11:55
When the elves aren't around to help with the holiday festivities, Santa can always count on R programmers to do the job! After getting my Master's Degree in Statistics last year, I was slowly losing my knowledge of R, which I obtained from my graduate education. Since I enjoyed programming in R so much, I wanted to figure out how to preserve my knowledge of it. At the same time, I wanted to spread some holiday cheer during the Christmas season, which was around the time I began to realize how much I have not kept practicing my R programming skills as much as I used to. Inspired by examples of aRtistry I saw online, I found a way to do both; I drew a Christmas card using R code. It involved rigorous pre-planning, storyboarding, lots of trial and error, and of course, the ggplot2 package to design it. In this talk, I'll explain my entire creative process behind creating this Christmas card with R, and show how it deepened my understanding of the grammar of graphics. This talk shares with the audience a unique way of using R to create R attendees can explore and learn from, which both align with R Cascadia's goal of promoting different uses of R, having learning opportunities, and connect R programmers with one another.
 |
Pronouns: he/himSan Jose, CAKen Vu is an R enthusiast who first learned the programming language while completing his MS in Statistics at California State University - East Bay. Currently, he provides data insights, survey research, and online content curation services for non-profit and public organizations, especially in areas concerning education or environmental conservation.Additionally, he co-faciliates the r4ds book club as a member of the r4ds Online Learning Community, providing inclusive and accessible ways for R users of all skill levels and backgrounds to learn data science techniques in R. In his spare time, he enjoys hiking, writing for his Quarto blog The R Files, and eating at new restaurants with friends and family. You can find Ken Vu on Mastodon at @kenvu777. |
L. K. Borland
Decoding R needs: Bridging the gap with university library workshops
Lighting Talk, 2:30 - 2:55 PM
Many university students and faculty members are expected to know R for their advanced courses or research, but access to formal teaching can be patchy at best, even in those programs that expect a certain level of knowledge and skill. Transfer students, nontraditional students, and faculty can slip through the cracks in relation to learning R or coding languages overall.
The university library has the framework and capacity to provide shorter workshops on technical topics, and can be a great resource for these learners looking to get more structured instruction. However, developing a curriculum that addresses the needs of all disciplines on campus and all levels of experience with coding languages can be challenging.
We investigated the audience that were interested in or attended our workshops on R through the library, and used what we learned to tailor the workshops to the broad range of students and faculty needs. Here, we discuss the challenges of meeting the needs we identified, including varying backgrounds, specialties, and learning styles, and how we are creating solutions to scaffold learning to meet learners where they are at.
Our approach includes teaching two different types of introductory workshops, varying in pace, format, and topics covered. By incorporating our assessment of the target audience and the availability of other resources on campus, we aim to bridge the gap in R education at the university level and enhance learning opportunities for our community.
 |
Pronouns: they/themCorvallis, OR, USABorland is a data management coordinator at the Oregon State University Library. With a background in marine science and geography, they have worked with R for many years and are passionate about sharing knowledge and skills with new users of the language, from undergraduate students to tenured faculty. |
Lindsay Dickey
Simplify repetitive report creation
Lighting Talk, 10:55 - 11:20 AM
Slice a dataset and create individualized reports with efficiency. In this example, survey data collected from several organizations is analyzed, and results prepared overall and by organization. Using markdown and through parameters, a report with individual organization and overall results is created for each organization.
 |
Pronouns: she/herPortland, OR, USALindsay Dickey has been learning R for the past 3 years as part of the analyst team at Center for Outcomes and Research Education (CORE). R helps her document and easily modify analyses; her go-to function in tbl_summary(). Lindsay currently resides in southern Colorado but she left a good chunk of her soul in the mossy doug fir forests of Portland. |
Lovedeep Gondara
Using R Shiny for cancer surveillance, lessons from the trenches
At British Columbia Cancer Agency, we have embarked on moving all of our cancer surveillance reports to R Shiny dashboards (Example: https://bccandataanalytics.shinyapps.io/IncidenceCounts/). This talk will focus on the roadmap, why we decided to move to R shiny, the challenges we faced implementing it within a public healthcare system and the outcome. The talk will touch on the pros and cons of various approaches such as using package-based development (golem), data privacy, other add-ons needed for the apps to be functional surveillance dashboards, etc. We will end the talk with outlining further adaptation of R Shiny in the form of interactive nomograms for research studies.
 |
Pronouns: he/himVancouver, BC, CanadaLovedeep Gondara is a Research Scientist at Provincial Health Services Authority (PHSA) in British Columbia and has a PhD in computer science. His current job involves research and applications of deep learning in healthcare domain. In his past role, he was a statistician/data scientist at British Columbia Cancer Agency, PHSA, where he was involved in conceptualizing, design, and development of R shiny apps for cancer surveillance. |
Lovekumar Patel
Empowering Decisions: Advanced Portfolio Analysis and Management through Shiny
Lighting Talk, 1:40-1:45
In this talk, I present a pioneering system for portfolio analysis and management, crafted using the power of Shiny and the versatility of the Plumber API. Our objective was to disrupt the status quo by offering immediate, actionable insights through a highly interactive toolset, designed with the user firmly at the center. I will discuss the journey of developing reusable Shiny modules, which stand as the pillars of this user-centric innovation, providing tailored solutions for diverse financial scenarios. I will explore the system's architecture, highlighting the Plumber API's dual functionality. Not only does it drive our system, but it also embraces other applications, reflecting a seamless cross-platform integration. This reflects our system's unique ability to span across different teams and adapt to varying technological ecosystems. The crux of our system is its ability to convert intricate financial data into a lively and engaging experience. This is made possible through a bespoke R package that synergizes with the ag-grid JavaScript library, allowing for intuitive and potent interaction with financial data grids. Attendees of this session will gain insights into the innovative application of Shiny and Plumber API in financial analytics, embodying a novel approach that prioritizes a user-first philosophy, code reusability, and cross-platform operability. The takeaways promise a compelling vision of financial analysis and decision-making, powered by R's flexible and robust capabilities.
 |
Pronouns: he/himSeattle, WALovekumar is a senior consultant and developer at ProCogia, specializing in building end-to-end data science products. With an MS in Engineering Management focused on data science from Northeastern University, he brings over five years of experience in the consulting industry.He excels in creating RESTful APIs, developing enterprise-ready data-intensive web applications, and crafting decision-making data reports. His expertise also includes statistical modeling, developing R packages, and harnessing R's capabilities across various domains. He holds an AWS Certified Solution Architect credential. At ProCogia, he works with various clients to develop and implement data-driven solutions, showcasing his proficiency in transforming concepts into production-ready solutions. His role includes leading teams in agile environments and handling client-facing responsibilities from requirement gathering to deployment. |
Lydia Gibson
Learning Together at the Data Science Learning Community
Regular talk, 3:15-3:30
Whether we are seeking our first job as a data professional or continuing a journey years in the making, we must all constantly learn new data programming skills to keep up with a rapidly changing world. Bootcamps and courses are often expensive, and it can be difficult to maintain the motivation necessary to learn skills on our own. The Data Science Learning Community is here to help. You may have heard of us previously as the R4DS Online Learning Community. We started with a handful of nontraditional learners reading R for Data Science together, but we’re about much more than any single book. For more than four years, we’ve organized weekly book clubs to help data science learners and practitioners read books such as R for Data Science, Advanced R, and Mastering Shiny. In contrast with other online book clubs, our safe, nurturing, small-group cohorts finish reading their books cover-to-cover. Come learn the tips and tricks that lead to the success of our clubs. In addition to our book clubs, the thousands of members of our diverse community also support one another by asking and answering programming questions in our Slack help channels. I’ll discuss how we keep those channels friendly and inclusive, and how we work to ensure that we answer every question. I’ll also show you where you can find over 600 curated datasets to practice those data skills. We post new datasets weekly as part of our #TidyTuesday social data project, and invite learners to practice their data visualization and machine learning skills, and share their learning back to the community. Come discover how you can help us make sure all of this remains absolutely free for everyone who wants to learn, worldwide. I encourage anyone who would like to gain and maintain expertise in data science techniques to attend my talk.
 |
Pronouns: she/herHillsboro, ORLydia Gibson received her M.S. in Statistics from CSU East Bay in May 2023, and currently works as a Data Scientist at Intel in the Foundry Technology Development business unit. She's passionate about bringing people together around common goals of shared learning in diverse and inclusive communities such as the DSLC (formerly known as the R4DS Online Learning Community). When it comes to coding, her personal interests include using the R programming language to explore the intricacies of data visualization. |
Mark Niemann-Ross
Use R to control a Raspberry Pi
The Raspberry Pi is a credit-card sized single board computer for less than $30. Most people think of it as an educational toy, but in reality it is a full-fledged linux computer with a full bank of data acquisition pins. The Raspberry Pi can read data from a multitude of sensors and control motors, cameras, and lights.
Most commonly, the Raspberry Pi is programmed in Python – but with a small amount of work, R can also be installed. Better yet, R can be used to read sensors and control output devices just like python.
In this fifteen minute talk, Mark Niemann-Ross will demonstrate the installation of R and show how to use it to blink lights, read sensors, and react to buttons. Participants will leave this talk with a clear path for use of the Raspberry Pi as a computing platform capable of data acquisition and processing with the R language.
 |
Pronouns: he/himPortland, OR, USAI write science fiction. Sometimes it’s about spaceships, sometimes it’s about products. The goal is the same; explain where we want to be, point out hazards, celebrate arrival. I live in Portland Oregon and teach R and Raspberry Pi for LinkedIn Learning. |
Matthew Bayly
CEMPRA: Building an R package, R Shiny application, and Quarto book for Cumulative Effect Assessments in BC
Regular talk, 1:40-1:55
This presentation will showcase the development of the CEMPRA (Cumulative Effect Model for the Prioritization of Recovery Actions) tool and its use in British Columbia. CEMPRA was developed as an R package and R Shiny application for different end users. This talk will demonstrate core principles of software engineering within the R universe. We will show how we can take very large and complex applications and break them down into small and simple components with modules, decouple core functionality within an R package and web components in a Shiny application, and leverage tools and techniques to simplify application development. Finally, we will demonstrate how to use Quarto websites and e-books to document our projects and run workshops and tutorial series.
 |
Pronouns: he/himWhistler, British ColumbiaBuilding R packages, R Shiny applications, APIs, and web systems with a background in aquatic science and web development & trying to help others along the way :) |
Mauro Lepore
Creating a better universe with dverse
Regular talk, 9:40 - 10:40 AM
The Tidyverse popularized the idea of a “package universe.” A typical universe has a meta-package that centralizes access to functions and data across all its packages. For example by using library(tidyverse) the tidyverse meta-package centralizes access to functions and data from dplyr ggplot2 and several other packages within the Tidyverse universe.
However meta-packages typically do not centralize documentation. For example the tidyverse website only displays the documentation for tidyverse but not for dplyr ggplot2 and other packages in the Tidyverse. A notable exception is tidymodels whose website allows users to search the documentation for all its packages at https://www.tidymodels.org/find/all though its implementation is ad hoc and complex.
This talk introduces a new package that solves this problem (https://maurolepore.github.io/dverse/). dverse creates a data.frame with metadata related to the documentation of any set of packages. This data.frame can be easily used to generate the standard reference section of a website with pkgdown. In this way dverse centralizes the documentation of any universe simply and in the expected place.
This way dverse connects multiple packages and their developers. In large and distributed universes like the Pharmaverse a central documentation built with dverse provides the opportunity for each developer to discover and learn about the others. The result is better documentation packages and community.
 |
Pronouns: he/himAstoria, OR, USAMauro Lepore is a Research Software Engineer focused on building open source systems in and around R. I've developed several R packages on CRAN and Shiny apps that help make data more accessible. I contribute to the R community as an associate editor and mentor at rOpenSci, and as an instructor with The Carpentries. I'm especially interested in making research more reproducible, open, and collaborative. |
Megan Holtorf
Taking Action While You Sleep: Using GitHub Actions to Schedule Email Updates
Lighting Talk, 10:55 - 11:20 AM
Keeping your audience informed shouldn’t be a manual chore. When Megan set out to streamline email updates for her local running group, she realized that manually checking for new events and sending emails was time consuming and tedious. Automating the process with a local script was an option—but keeping her computer on 24/7? Not ideal. Instead, she turned to GitHub Actions, a cloud-based automation tool, to handle everything while she slept.
In this lightning talk, Megan will demonstrate how to automate a workflow using R and GitHub Actions. She’ll walk through fetching events from Google Calendar with {ical}, formatting email content with {quarto}, sending emails via {blastula}, and scheduling it all seamlessly in GitHub Actions.
By the end of this talk, attendees will see how GitHub Actions can take repetitive tasks off their plate, whether for email updates, report generation, or other automated workflows—even while they sleep.
 |
Pronouns: she/herRenton, WA, USAMegan Holtorf is the Data & Analytics Manager at Providence's Center for Outcomes Research and Education (CORE), where she works closely with researchers and community partners to evaluate innovative healthcare programs and advance health services research. Megan has extensive experience analyzing large administrative data sets, surveys, and civic data. She has been the analytic and technical lead for a multi-year statewide evaluation of philanthropic investments in community health equity, evaluated alternative payment models and other health reform initiatives within Oregon's coordinated care system, and led development of statewide quality metric dashboards. |
Melissa Bather
Using R to Estimate Animal Population Density
Spatially explicit capture-recapture (SECR) models are used to estimate animal population densities within specified areas of space by detecting and then re-detecting animals at different points in time within the region of interest. They are important tools for conserving, monitoring, and managing animal species. There are a number of different animal detection methods used for these models, including trapping, tagging, and then releasing animals, hair snares, and even microphones to record animal vocalizations. This allows researchers to study animals from a broad range of sizes – from tiny mice and frogs all the way to grizzly bears and even whales – and in a range of different habitats.There are a few R packages that allow us to build SECR models quite simply using animal capture histories from numerous detection methods, including SECR, ASCR, and a new package ACRE which is particularly good for acoustic SECR models. This talk will cover the different methods used to detect animals, how detections are recorded, and the implementation and high-level interpretation of SECR models in R, along with visualizations of the core concepts of SECR models using R.
 |
Pronouns: she/herVancouver, BC, CanadaI recently moved to British Columbia from New Zealand, where I used to build R Shiny apps for the health sector. I’m currently studying a MSc in Statistics part time through the University of Auckland (the birthplace of R!) and I’m due to finish in November 2023. My research project is to assist in the development and validation of an R package for estimating animal population densities based on various capture methods, particularly acoustic methods. I have been using R for seven years and currently co-organise the R Ladies Vancouver meetup group. Right now I work as a Data Engineer in Vancouver. |
Mohsen Soltanifar
SimSST: An R Statistical Software Package to Simulate Stop Signal Task Data
The stop signal task (SST) paradigm with its original roots in 1948 has been proposed to study humans’ response inhibition. Several statistical software codes have been designed by researchers to simulate SST data in order to study various theories of modeling response inhibition and their assumptions. Yet, there has been a missing standalone statistical software package to enable researchers to simulate SST data under generalized scenarios. This paper presents the R statistical software package “SimSST”, available in Comprehensive R Archive Network (CRAN), to simulate stop signal task (SST) data. The package is based on the general non-independent horse race model, the copulas in probability theory, and underlying ExGaussian (ExG) or Shifted Wald (SW) distributional assumption for the involving go and stop processes enabling the researchers to simulate sixteen scenarios of the SST data. A working example for one of the scenarios is presented to evaluate the simulations’ precision on parameter estimations. Package limitations and future work directions for its subsequent extensions are discussed.
 |
Pronouns: he/himVancouver, BC, CanadaMohsen Soltanifar is currently Senior Biostatistican at ClinChoice and an adjunct lecturer at Northeastern University in Vancouver, BC, Canada. He has 2+ years experience in CRO/Pharma and 8+ years experience in Healthcare. His main area of interest in statistics is Clinical Trials with focus of R software applications in their design, analysis, and result presentations. He got his PhD in Biostatistics from University of Tornoto in Canada in 2020 and as of that year has served as registered reviewer for 15+ journals including "Current Oncology" and "Clinical and Translational Neurosicence(CTN)". |
Mohsen Soltanifar
GenTwoArmsTrialSize: An R Statistical Software Package to estimate Generalized Two Arms Clinical Trial Sample Size
Lighting Talk, 1:50-1:55
The precise calculation of sample sizes is a crucial aspect in the design of two-arms clinical trials, particularly for pharmaceutical statisticians. While various R statistical software packages have been developed by researchers to estimate required sample sizes under different assumptions, there has been a notable absence of a standalone R statistical software package that allows researchers to comprehensively estimate sample sizes under generalized scenarios. This talk introduces the R statistical software package “GenTwoArmsTrialSize,” available on the CRAN, designed for estimating the required sample size in two-arm clinical trials. The package incorporates four endpoint types, two trial treatment designs, four types of hypothesis tests, as well as considerations for noncompliance and loss of follow-up, providing researchers with the capability to estimate sample sizes across 24 scenarios. To facilitate understanding of the estimation process and illuminate the impact of noncompliance and loss of follow-up on the size and variability of estimations, the paper includes a practical example covering four scenarios. The discussion encompasses the package’s limitations and outlines directions for future extensions and improvements.
 |
Pronouns: he/himVancouver, BC, CanadaMohsen Soltanifar is an accredited statistician by Statistical Society of Canada with 3.0+ years post-PhD level experience in CRO/Pharma; 5.0+ years experience in Healthcare and 4.0+ part time teaching experience in North American academia. His main area of interest in statistics are Clinical Trials with focus of R software applications in their design, analysis, and result presentations. |
Mohsen Soltanifar
CMHSU: An R Statistical Software Package to Detect Mental Health Status Substance Use Status and Their Concurrent Status in the North American Healthcare Administrative Databases
Lighting Talk, 2:30 - 2:55 PM
The concept of concurrent mental health and substance use (MHSU) and its detection in patients has garnered growing interest among psychiatrists and healthcare policymakers over the past two decades. Researchers have proposed various diagnostic methods, including the Data-Driven Diagnostic Method (DDDM), for the identification of MHSU. However, the absence of a standalone statistical software package to facilitate DDDM for large healthcare administrative databases has remained a significant gap. This paper introduces the R statistical software package CMHSU, available on the Comprehensive R Archive Network (CRAN), for the diagnosis of mental health (MH), substance use (SU), and their concurrent status (MHSU). The package implements DDDM using hospital and medical service physician visit counts along with maximum time span parameters for MH, SU, and MHSU diagnoses. A working example with a simulated real-world dataset is presented to explore three critical dimensions of MHSU detection based on the DDDM. Additionally, the limitations of the CMHSU package and potential directions for its future extension are discussed.
 |
Pronouns: he/himVancouver, BC, CanadaDr. Mohsen Soltanifar is a mathematical statistician with over three years of experience in contract research organizations (CROs) and the pharmaceutical industry, more than five years in healthcare industry, and over four years of part-time teaching in North American academia. His primary research interests encompass clinical trials and real-world evidence, with a focus on leveraging R software for study design, data analysis, and results presentation. Dr. Soltanifar has published in several therapeutic areas, including psychiatry, psychology, pulmonology, and pediatrics. He earned his PhD in Biostatistics from the University of Toronto, Canada, in 2020 and is accredited as a Professional Statistician (P.Stat) by the Statistical Society of Canada, effective 2024. |
Nathan TeBlunthuis
Misclassification Causes Bias in Regression Models: How to Fix It Using the MisclassificationModels Package
Automated classifiers (ACs), often built via supervised machine learning, can categorize large and statistically powerful samples of data ranging from text to images and video, and have become widely popular measurement devices in many scientific and industrial fields. Despite this popularity, even highly accurate classifiers make errors that cause misclassification bias and misleading results in downstream analyses—unless such analyses account for these errors.
In principle, existing statistical methods can use “gold standard” validation data, such as that created by human annotators and often used to validate predictiveness, to correct misclassification bias and produce consistent estimates. I will present an evaluation of such methods, including a new method implemented in the experimental R package misclassificationmodels, via Monte-Carlo simulations designed to reveal each method’s limitations. The results show the new method is both versatile and efficient.
In sum, automated classifiers, even those below common accuracy standards or making systematic misclassifications, can be useful for measurement with careful study design and appropriate error correction methods.
 |
Pronouns: He/Him or They/ThemSeattle, WA, USANathan TeBlunthuis is a computational social scientist and postdoctoral researcher at the University of Michigan School of Information and affiliate of the Community Data Science Collective at the University of Washington. Much of Nathan's research uses R to study Wikipedia and other online communities using innovative methods. He earned his Ph.D. from the Department of Communication at the University of Washington in 2021 and has also worked for the Wikimedia Foundation and Microsoft. |
Nikhita Damaraju
R-tificial intelligence: A guide to using R for ML
Regular talk, 9:55-10:10
If you've ever been told that “R is not for ML” or found the transition from data processing to ML algorithms cumbersome, this session is for you. The discussion begins by acknowledging the statistical foundations of R users in academia, often rooted in statistics classes. However, I will discuss the need for ML skills, emphasizing that ML algorithms can sometimes, offer superior solutions to real-world problems compared to traditional statistical approaches. Through compelling examples, such as predicting heart attacks, forecasting machine failures, and customer product recommendations, I will highlight scenarios where ML can outshine conventional statistical methods. The talk is structured into three main parts, each designed to equip participants with the knowledge and skills to harness the predictive modeling capabilities of R. The first part delves into the rich landscape of R packages tailored for ML tasks. Classification, regression, and clustering are explored within the broader categories of supervised and unsupervised learning. Participants will gain insights into selecting the right packages for specific tasks, fostering an understanding of the versatility R brings to ML endeavors. Moving to the second part, the discussion transitions to general best practices for data processing and preparation. Emphasis is placed on the importance of steps like making training and validation datasets, practical tips and techniques to optimize data for ML model training. The final part of the talk focuses on the evaluation of ML models using an example dataset. I will discuss the process of assessing model performance and making informed decisions based on the results. Additionally, I will offer suggestions for effective visualization techniques, enabling participants to communicate their findings in a clear and compelling manner to their teams. By the end of this session, participants will not only understand the seamless integration of data preprocessing, model training, and evaluation in R but also be equipped with practical knowledge to navigate the ML landscape using R packages.
 |
Pronouns: she/herSeattle, WANikhita is pursuing her PhD at the University of Washington's Institute for Public Health Genetics. Before this, she completed an MS in Biostatistics from Columbia University and a dual degree (BS-MS) from the Department of Biotechnology at the Indian Institute of Technology Madras. Over the past six years, through a mix of coursework, teaching, and research projects, Nikhita has developed her experience in using various R packages for tasks like data wrangling, machine learning, bioinformatics, and data visualization. She is deeply interested in the intersection of Data Science and Biology within the realm of Public Health and aspires to contribute to the field of Precision Medicine in the future. |
OG CascadiaR committee
Retrospective of Cascadia R
 |
Jessica MinnierPronouns: she, herPortland, OR, USAJessica is a biostatistician and faculty at OHSU-PSU School of Public Health and Knight Cancer Institute in Portland. She helped organize the first and second Cascadia R Conf starting in 2017 and is grateful the Pacific Northwest R community is still thriving. She has been teaching R for quite some time for her day job and also at other R and biostatistics conferences, and is passionate about helping people new to coding to feel empowered to work with data using R. |
 |
Ted LaderasPronouns: he, himPortland, OR, USATed is a founding member of the Cascadia-R conference. He is a bioinformatics trainer and data science mentor. He trains and empowers learners in learning how to utilize cloud platforms effectively and execute and communicate effective data science. He also is a co-organizer of the PDX-R user group and visualizing Tidy Tuesday datasets in his free time. |
Peter Geissert
Metadata Driven Data Science
Regular talk, 1:30 - 2:30 PM
Many data science teams face unprecedented demands for data products and actionable intelligence. This presentation will showcase the work that the Oregon EMS Program has done to build workflows using metadata to drive data extraction cleaning analysis and visualization. This approach allows us to get upstream of the many projects that we develop and/or update every year/quarter/month to make changes in only one place; our data dictionary. Using a modular approach functions and scripts are built to pull in information about data elements values relationships and metrics from metadata repositories and allow us to produce more consistent validated data products more quickly.
The presentation is designed to be accessible to a general audience regardless of programming/coding experience. All examples given will be using our EMS dataset and the R programming language and R Studio IDE but a similar approach could be implemented using any database or in other languages such as Python SAS etc.
 |
Pronouns: he/himPortland, OR, USA |
R-Ladies+
R-Ladies+ is returning to Portland this year!
Lighting Talk, 2:30 - 2:55 PM
Learn more about R-Ladies+ and our newly active chapter in Portland.
 |
R-Ladies+ is a worldwide organization whose mission is to promote gender diversity in the R community. The R community suffers from an under-representation of minority genders (including but not limited to cis/trans women, trans men, non-binary, genderqueer, agender) in every role and area of participation, whether as leaders, package developers, conference speakers, conference participants, educators, or users. As a diversity initiative, the mission of R-Ladies is to achieve proportionate representation by encouraging, inspiring, and empowering people of genders currently under-represented in the R community. R-Ladies’ primary focus, therefore, is on supporting minority gender R enthusiasts to achieve their programming potential, by building a collaborative global network of R leaders, mentors, learners, and developers to facilitate individual and collective progress worldwide. Learn more at |
R/RStudio for Beginners Workshop
Friday June 26, 2026
1:30 - 4:30 PM
Karl Miller Center, 615 SW Harrison Street, Portland, OR
Room KMC TBD
This is an introductory workshop to R for beginners. We will talk about reading data with R and organizing it in variables, vectors, and matrices. We will perform some basic operations on an example dataset (mean, maximums, minimums) pre-installed in base R, and create some simple visualizations. We will talk about writing R functions. We recommend that you install R and RStudio in your own computer for the workshop, but you can also access it via Posit. For information about setting up R in your computer visit https://rstudio-education.github.io/hopr/starting.html.
Knowledge Prerequisites: None.
Pre-Installations: A recent version of R and RStudio.
Instructor
L.K. Borland
Pronouns: They/them
Location: Corvallis, Oregon
I am a data management coordinator at the Oregon State University Library. I have a background in geography and ecology, specifically marine science, but I work with many different disciplines in my work now! I curate our institutional data repository, ScholarsArchive@OSU, help researchers with planning their data management, encourage open-access data publishing, and provide workshops on introductions to R and Python.
Randi Bolt
Code to Content
Lighting Talk, 1:35-1:40
In my presentation ‘Code to Content,’ I will explore the transformative journey of honing technical skills through blogging. I will discuss the motivations behind starting a blog, detail the Quarto-based blogging process, offer essential advice, and provide a curated selection of resources to help get one started with their blogging endeavors.
 |
Pronouns: she/herPortland,ORRandi Bolt is an accomplished data analyst with a deep-seated passion for the R programming language. Beginning her R journey while earning a BS in Mathematics at Portland State University, she has since dedicated herself to exploring a wide range of topics through a data-driven lens. Her commitment to continuous improvement and her ability to apply her skills across diverse industries have made her a valuable contributor to the technical community. |
Russell Shean
Just double click on this to automatically to setup an R environment: How to use batch scripts to make it easier for colleagues to start using your R projects
Regular talk, 3:45-4:00
Presenting Author: Russell Shean Co-authors: Roxanne Beauclair and Zeyno Nixon Background: The Visualization Section within the Center for Data Science at the Washington Department of Health produces dashboards for other teams within our agency. This involves developing pipelines in R to process data for routine data refreshes. Other teams are expected to run these scripts after development. Previously, collaborating teams were trained to do data refreshes using a 42-step process. The training took approximately 60 minutes and trainees frequently encountered errors caused by missing or incorrectly configured software. We share how we were able to reduce errors and training time using batch scripts to automatically download and configure all the required software and files for our R pipelines. Methods: We wrote windows batch scripts to automatically download, install and configure R, RStudio, Rtools, Pandoc, and git. The scripts also automatically clone a GitHub repo containing all the project’s code into a folder that the user can choose using a popup window. While running, color coded messages appear telling the user what setup steps are happening. We also wrote a second batch script which automatically runs our R data processing scripts for the dashboard refresh. The second script automates additional environment setup tasks, such as: ensuring the VPN and network drives were connected; pulling changes from GitHub; and running commands from the renv package to ensure package versions are correct. Results: This approach was implemented for our Unintentional Overdose Deaths (SUDORS) dashboard. Eleven team members tested this new process and provided feedback in team retrospectives. In testing, training time went from approximately 60 minutes to 5 minutes. Several common errors caused by missing or incorrectly configured software and users forgetting steps or running steps out of order were prevented, drastically reducing the time spent addressing other questions about error messages or unexpected results. Conclusion: This approach has not been widely tested among other teams at the agency. However, public health organizations developing data processing scripts may want to consider implementing similar strategies to make it easier for users without programming experience to set up a computing environment, run scripts themselves and get reproducible results without errors introduced from software environment configurations. Connection to R Cascadia conference: Sometimes it can be difficult to convince non-R users to use R code because there is a lot of software that needs to be downloaded and configured first. Software that is installed incorrectly or in the wrong order can introduce difficult to diagnose errors frustrating new users. The batch scripts are not written in R, but we still believe that this abstract is appropriate for an R conference because it demonstrates a strategy for reducing barriers to using R for new users.
 |
Pronouns: he/himSeattle, WARussell Shean is an epidemiologist at the Washington State Department of Health where he helps develop data visualization dashboards.You can connect with him on LinkedIn: https://www.linkedin.com/in/russell-shean |
Rust for R Developers From the Ground Up Workshop
Friday June 26, 2026
9:00 AM - 12:00 PM & 1:30 PM - 4:30 PM
Karl Miller Center, 615 SW Harrison Street, Portland, OR
Room KMC TBD
Rust is taking the world by storm due to its speed, safety, and efficiency. The extendr library provides a developer-friendly Rust alternative to Rcpp and cpp11, enabling you to build fast and scalable R packages. This workshop is tailored for R developers with no prior experience in Rust or compiled languages. Starting from the fundamentals, we'll cover essential Rust concepts by drawing parallels with R (morning workshop), then progress to building a complete Rust-based R package (afternoon workshop). You'll learn to write vectorized functions with robust error handling and create performant packages from the ground up using Rust and {rextendr}.
Knowledge Prerequisites: Intermediate expertise in R. This means familiarity with R's fundamental types: lists, atomic vectors, for loops / iteration, and writing
We strongly recommend participants take both parts of this workshop.
Instructor

Josiah Parry
Pronouns: He/him/his
Location: Seattle, Washington
Josiah Parry believes R belongs in production. He has a penchant for writing R packages that are really fast and efficient. Typically, this involves writing Rust and glueing R them together using extendr. He also, quite specifically, likes solving geospatial problems. He works at Esri doing spatial statistics and —you guessed it— writing R packages.
Learn more at josiahparry.com.
Samer Hijjazi
Navigating the BLS API with R: A Step-by-Step Guide
Lighting Talk, 2:30 - 2:55 PM
This talk will demonstrate how to leverage the Bureau of Labor Statistics (BLS) API in R to access the many different datasets provided by BLS. The BLS site offers lots of data pertaining to employment and consumer price indexes, all of which are connected to its API.
Throughout the session, best practices for working with the BLS API will be emphasized. Attendees will learn how to request the API key, how to use the httr package to access the data, and learn about the series ID format used by BLS as a way of labeling the different datasets.
This session is aimed at all levels of R users. You do not have to be an expert in R, nor in APIs to benefit from this session.
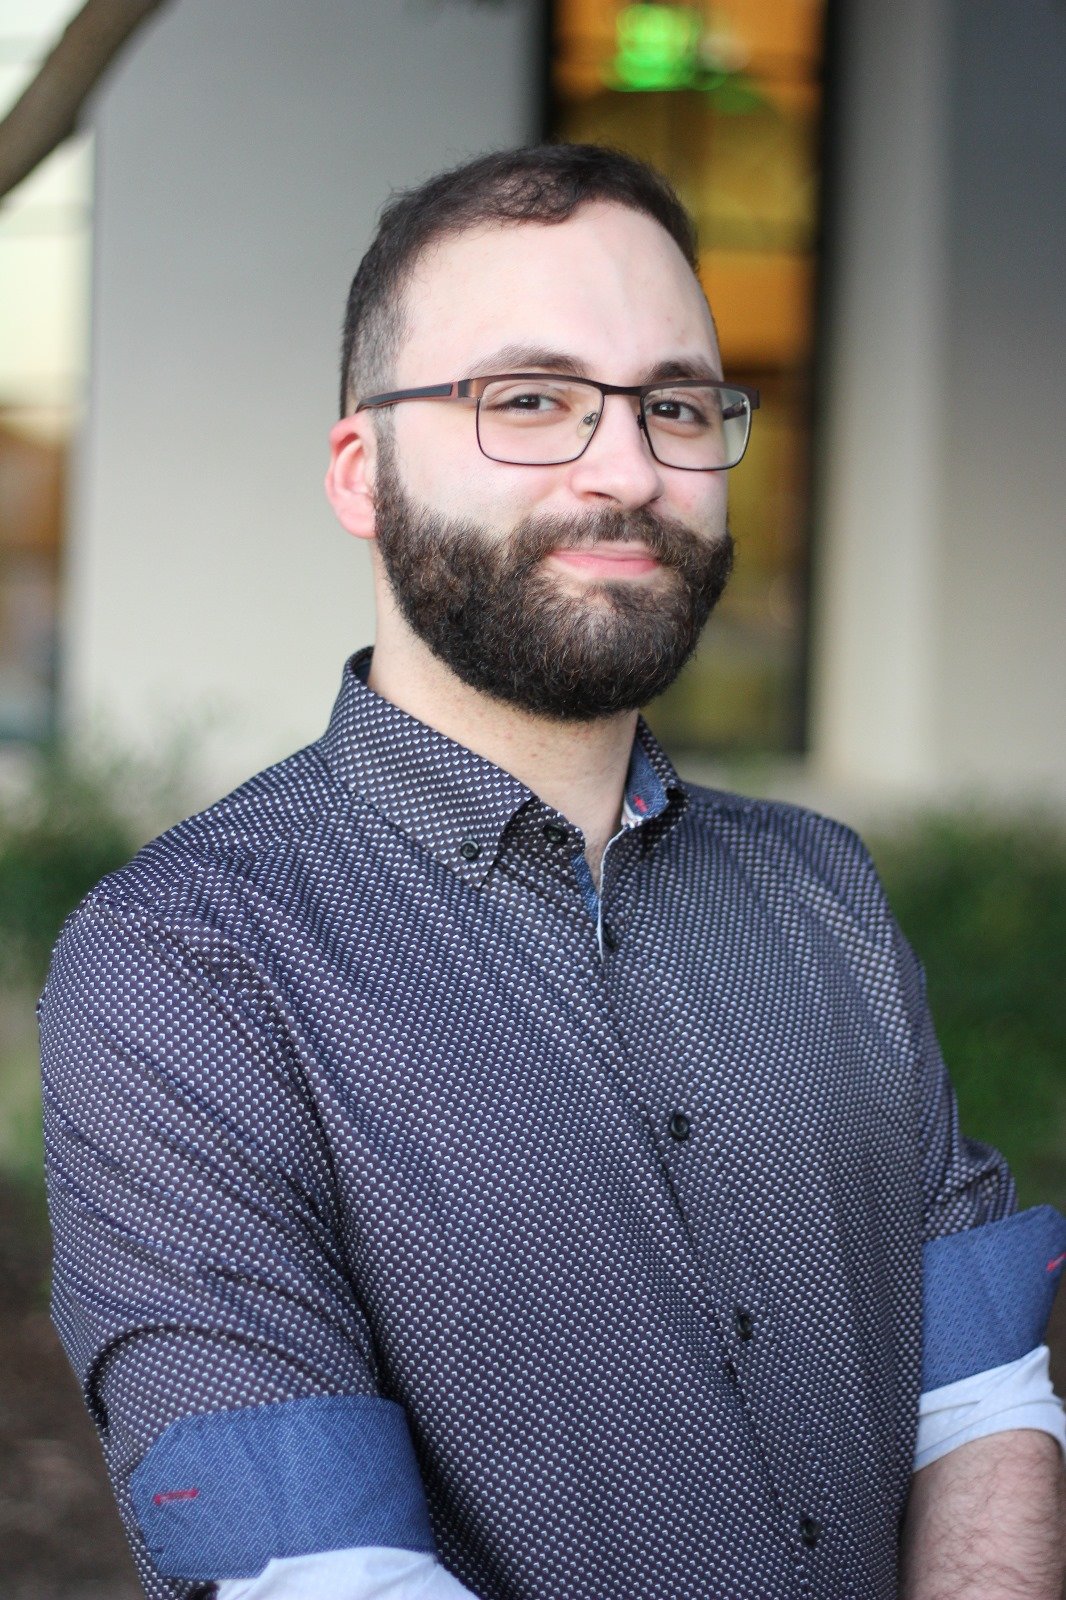 |
Pronouns: he/himHouston, TX, USASamer Hijjazi (pronounced as Sam-er He-jah-zee) currently works at MD Anderson Cancer Center in Texas as a Data Scientist in the Finance & Analytics department. His areas of expertise include data analysis and data collection, with an emphasis on web scraping. Samer has close to 5 years of experience working in Healthcare Administration, Higher Education, and Human Resource Analytics. In his spare time, Samer has his own YouTube channel (@SamerHijjazi) where he creates analytics content, primarily in R. |
Sean Kross
Visualize Data Analysis Pipelines with Tidy Data Tutor
The data frame is one of the most important and fundamental data structures in R. It is no coincidence that one of the leading domain specific languages in R, the Tidyverse, is designed to center the transformation and manipulation of data frames. A key abstraction of the Tidyverse is the use of individual functions that make a change to a data frame, coupled with a pipe operator, which allows people to write sophisticated yet modular data processing pipelines. However within these pipelines it is not always intuitively clear how each operation is changing the underlying data frame, especially as pipelines become long and complex. To explain each step in a pipeline data science instructors resort to hand-drawing diagrams or making presentation slides to illustrate the semantics of operations such as filtering, sorting, reshaping, pivoting, grouping, and joining. These diagrams are time-consuming to create and do not synchronize with real code or data that students are learning about. In this talk I will introduce Tidy Data Tutor, a step-by-step visual representation engine of data frame transformations that can help instructors to explain these operations. Tidy Data Tutor illustrates the row, column, and cell-wise relationships between an operation’s input and output data frames. We hope the Tidy Data Tutor project can augment data science education by providing an interactive and dynamic visualization tool that streamlines the explanation of data frame operations and fosters a deeper understanding of Tidyverse concepts for students.
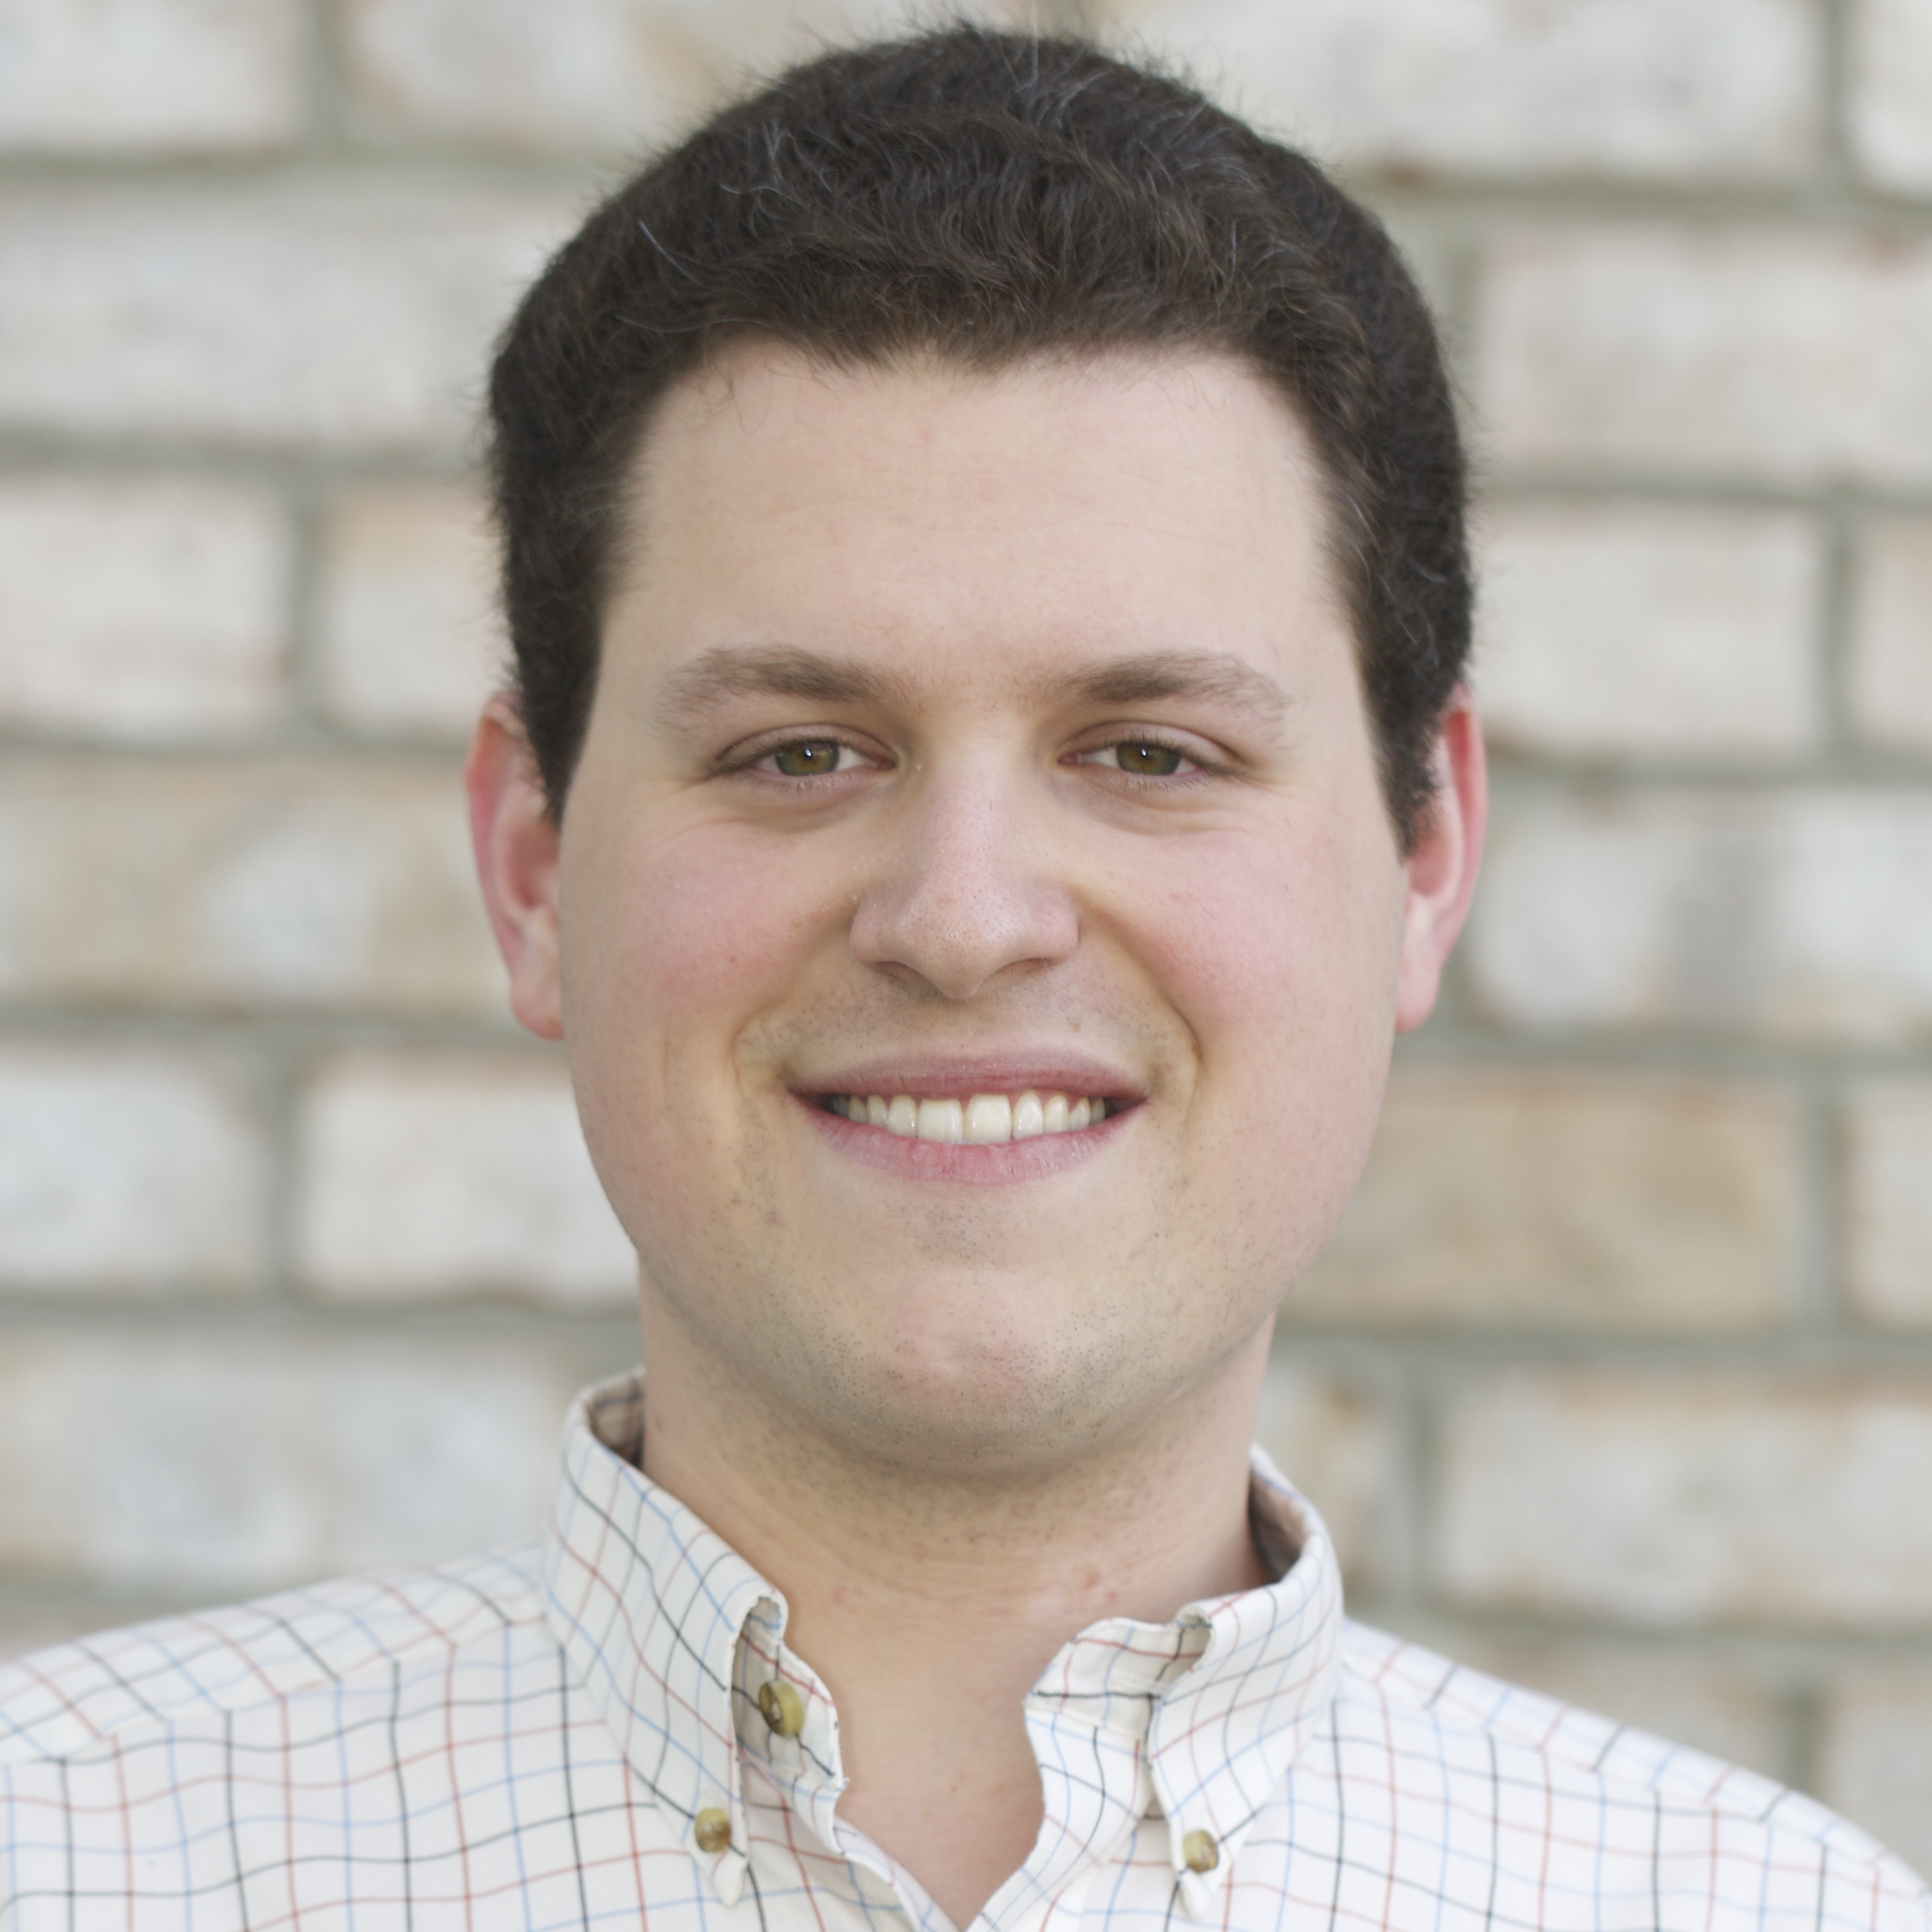 |
Pronouns: he/himSeattle, WA, USASean Kross, PhD is a Staff Scientist at the Fred Hutch Data Science Lab. His work is focused on understanding data science as a practice, building a better developer experience for data scientists, and creating better outcomes in digital education. He approaches these challenges with computational, statistical, ethnographic, and design-driven methods. |
Simon Couch
Fair machine learning
Regular talk, 10:25-10:40
In recent years, high-profile analyses have called attention to many contexts where the use of machine learning deepened inequities in our communities. A machine learning model resulted in wealthy homeowners being taxed at a significantly lower rate than poorer homeowners; a model used in criminal sentencing disproportionately predicted black defendants would commit a crime in the future compared to white defendants; a recruiting and hiring model penalized feminine-coded words—like the names of historically women's colleges—when evaluating résumés. In late 2022, a group of Posit employees across teams, roles, and technical backgrounds formed a reading group to engage with literature on machine learning fairness, a research field that aims to define what it means for a statistical model to act unfairly and take measures to address that unfairness. We then designed functionality and resources to help data scientists measure and critique the ways in which the machine learning models they've built might disparately impact people affected by that model. This talk will introduce the research field of machine learning fairness and demonstrate a fairness-oriented analysis of a model with tidymodels, a framework for machine learning in R.
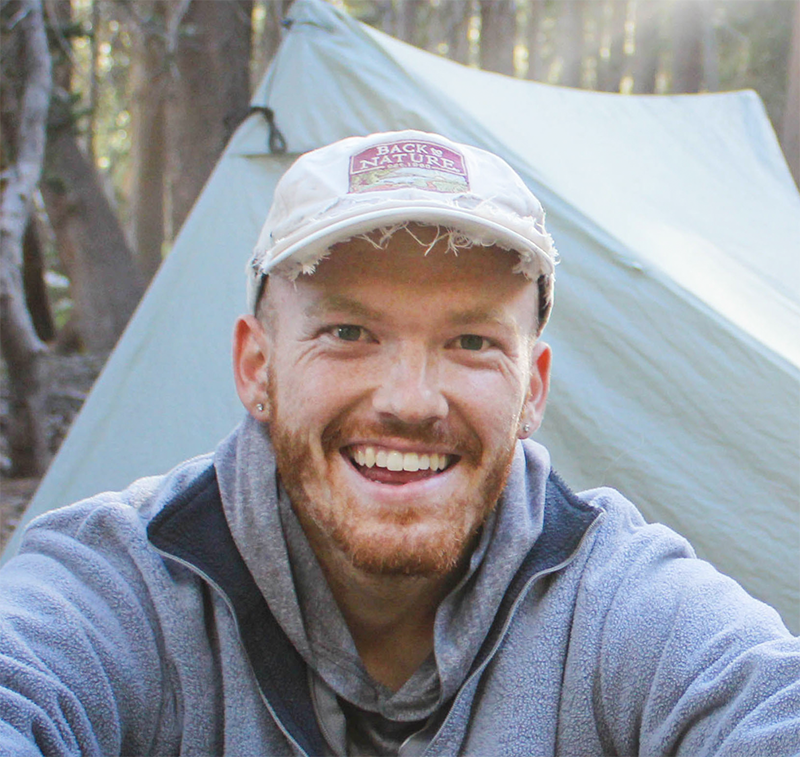 |
Pronouns: he/himChicago, ILSimon Couch is a software engineer at Posit PBC (formerly RStudio) where he works on open source statistical software. With an academic background in statistics and sociology, Simon believes that principled tooling has a profound impact on our ability to think rigorously about data. He authors and maintains a number of R packages and blogs about the process at simonpcouch.com. |
Ted Laderas
A gRadual introduction to web APIs and JSON
Do the words “Web API” sound intimidating to you? This talk is a gentle introduction to what Web APIs are and how to get data out of them using the {httr2}, {jsonlite}. and {tidyjson} packages. You'll learn how to request data from an endpoint and get the data out. We'll do this using an API that gives us facts about cats. By the end of this talk, web APIs will seem much less intimidating and you will be empowered to access data from them.
 |
Pronouns: he/himPortland, OR, USATed is a founding member of the Cascadia-R conference. He is a bioinformatics trainer and data science mentor. He trains and empowers learners in learning how to utilize cloud platforms effectively and execute and communicate effective data science. He also is a co-organizer of the PDX-R user group and visualizing Tidy Tuesday datasets in his free time. |
Ted Laderas
Never been to Me : A Queer Journey through the LGB Generations Data
Regular talk, 3:30-3:45
In this talk, I want to answer the question: How can data science connect me more deeply to my community? Specifically, I want to use publicly available data to understand my place in the LGBTQ+ community. I want to use it to discover commonalities and identify mental health issues we struggle with. To do this, I plan to use the publicly available Generations dataset, consisting of interviews and survey information across 3 generations of LGB people. I want to highlight the challenges we face from our families and our society. I also want to talk with other LGBTQ analysts about their insights of the Generations Data and synthesize this into a larger story about our community. By the end of this talk, I want to share key insights I've learned from the data into queer identity and our mental health challenges and how they have changed from generation to generation. I hope to showcase this talk as an example of how citizens can engage with public data for the greater good.
 |
Pronouns: he/himPortland, ORTed Laderas is a Data Scientist and Community Builder at Fred Hutch. He has worked with lots of different data types and knows his way around a workflow. He champions building learning communities of practice in science and research that are psychologically safe and inclusive. |
Valeria Duran
Maximizing Performance: Strategies for Code Optimization
Code optimization improves the performance and efficiency of a program and is essential in software development. Optimizing code involves modifying code that currently slows down a process. Identifying bottlenecks in the code is crucial in reducing the time required to process large datasets and perform computations. Deciding at what point optimization is vital, and if optimization is even needed, is an important task that any programmer will need to consider at some point. There are tradeoffs regarding code optimization, such as code readability, the time needed for modifications, debugging, and more, and weighing the benefits of optimization against these tradeoffs is essential in determining if it is worth pursuing. This talk will review what to consider when optimizing code and valuable tools.
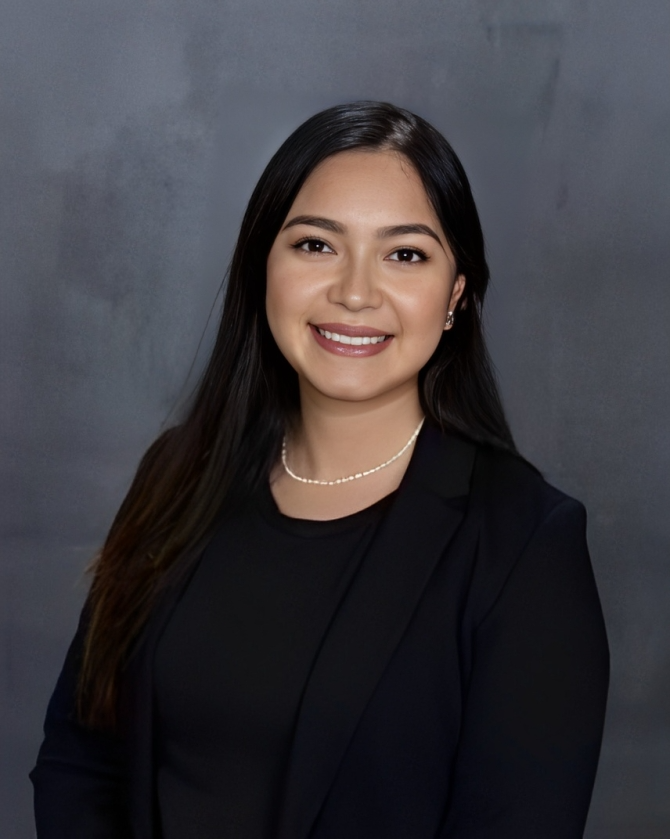 |
Pronouns: she/herSeattle, WA, USAValeria Duran has a B.S. in Mathematical Biology and M.S. in Statistics and Data Science from the University of Houston with four years of R programming experience. She is a Statistical Programmer at the Statistical Center for HIV/AIDS Research & Prevention (SCHARP) at Fred Hutchinson Cancer Center. |
Yan Liu
Leveraging Large Language Models in R: Practical Applications with {ellmer}
Regular talk, 9:40 - 10:40 AM
As Large Language Models (LLMs) become more accessible they offer R developers new opportunities to automate and enhance text analysis and generation tasks. For mixed-methods researchers LLMs can improve efficiency in both deductive and inductive coding for content analysis making them a valuable tool for streamlining qualitative research workflows.
This session will introduce practical applications of LLMs in R using the {ellmer} package focusing on three key use cases: image-to-text generation text classification and summarization. Through hands-on examples attendees will learn how to integrate LLMs into their workflows and evaluate the trade-offs between using local models versus cloud-based models.
Beyond technical implementation the session will cover essential prompt engineering techniques—providing actionable strategies for optimizing LLM outputs—as well as ethical considerations including bias interpretability and current limitations.
By the end of this session participants will be equipped with practical tools best practices and insights into the evolving role of LLMs in R development. Attendees will leave with a clear understanding of how to apply these techniques to enhance the quality and efficiency of their own analytical work.
 |
Pronouns: she/herPortland, OR, USAYan Liu is a data analyst from Center for Outcomes Research and Education (CORE), where she leverages her expertise in survey work, data analysis and data visualization to drive impactful insights in healthcare. Yan is looking forward to sharing her latest findings on implementing large language models with R with real world examples. |
Zachary Ruff
Shiny_PNW-Cnet: AI-powered desktop audio processing for biodiversity research and monitoring
Passive acoustic monitoring is an increasingly popular approach in wildlife research and conservation, made possible by the availability of small, rugged, programmable audio recorders (autonomous recording units, or ARUs). Researchers can deploy ARUs across large areas and over long periods to capture sounds produced by rare and cryptic species such as the northern spotted owl and marbled murrelet, making it possible to study these species non-invasively at landscape scales. However, a major challenge with this approach is the need to efficiently detect target sounds within the resulting large audio datasets, which can easily comprise thousands of hours of recordings. Deep learning models are an increasingly popular solution but often require advanced programming skills, which hinders their adoption by wildlife researchers. The US government has monitored northern spotted owl populations since the mid-1990s as mandated by the Northwest Forest Plan. While this monitoring effort originally relied on callback surveys and mark-resight analyses, it began a transition to passive acoustic monitoring starting in 2018. As of 2023, the spotted owl monitoring program relies entirely on ARUs and may well be the world's largest acoustic data collection effort, bringing in roughly 2 million hours of audio per year from thousands of monitoring sites in Washington, Oregon, and California. To detect calls from the northern spotted owl and other species in this massive dataset, we developed PNW-Cnet, a TensorFlow-based deep neural net which detects audio signatures of target species in spectrograms. Originally trained to detect six species of owls, PNW-Cnet has grown iteratively over the years and now detects 37 species of birds and mammals found in the Northwest, expanding the scope of the program toward broad-scale biodiversity monitoring.
We recently developed a graphical desktop application to increase the accessibility of PNW-Cnet and to share the benefits of passive acoustic monitoring with wildlife biologists and the general public. The result is Shiny_PNW-Cnet, a Shiny app intended to be run locally through RStudio. The app uses PNW-Cnet to process audio data and detect target sounds in audio recordings, allows users to visualize apparent detections and extract them for manual review, and includes various utilities for organizing and renaming audio data and other miscellaneous tasks. This app is publicly available and is currently in use by biologists doing bioacoustics work for local, state, federal, and tribal governments, as well as private companies. We will discuss the context of the northern spotted owl monitoring program, the development and evolution of Shiny_PNW-Cnet over the past several years, successes, failures, lessons learned, planned features, and more. This talk is intended for R users of all levels and anyone else interested in how R is empowering the conservation of the Pacific Northwest's most iconic wildlife.
 |
Pronouns: he/himCorvallis, OR, USAZack Ruff is a research assistant in the Department of Fisheries, Wildlife, and Conservation Sciences at Oregon State University and works closely with the U.S. Forest Service through the Pacific Northwest Research Station. He is a wildlife ecologist by training and has previously worked with macaws, plovers, blackbirds, and grouse, but in recent years he has gravitated to projects where he gets to write more code and doesn't have to wear bug spray. Originally from Minnesota, he relocated to Oregon in 2017 and has been working on spotted owl monitoring ever since. His day-to-day work combines bioacoustics, machine learning, and population ecology, and in his spare time he enjoys birding, tinkering, trying new beers, and riding bikes. |
Zero to Website with Quarto Workshop
Friday June 26, 2026
1:30 - 4:30 PM
Karl Miller Center, 615 SW Harrison Street, Portland, OR
Room KMC TBD
As a data professional, you'll eventually want a website—whether for yourself, a project, or a research group. Quarto is an excellent way to build one: create your site with plain text files that you can edit in your favorite tool and check into version control; organize your content into folders and pages in a way that makes sense to you; create content that includes code and its output; and generate listing pages that help readers navigate collections of content like projects, publications, or people. In this workshop, you'll walk through the process from scratch. You'll see how to get started with a basic template and then customize it to your needs, including adding pages, customizing navigation, adding a blog or other listing, personalizing the appearance, and getting it online.
This workshop will be hands-on, and you'll need to prepare a few things before it begins. Look for instructions closer to the workshop date. It will help if you've already used Quarto to produce documents, but I'll provide resources to get you up to speed beforehand if you haven't. You don't need any HTML, CSS/SCSS, or Git/GitHub experience, nor do you need any particular programming language (R, Python, etc.) or level of programming experience.
Knowledge Prerequisites: Having used Quarto to produce single documents is recommended but not required.
Pre-Installations: Quarto > v1.8 (https://quarto.org/docs/download/)
Instructor

Charlotte Wickham
Pronouns: She/her/hers
Location: Corvallis, Oregon
Dr. Charlotte Wickham (she/her) is a Developer Advocate on the Quarto team at Posit, PBC. As part of her job at Posit, Charlotte helps to keep quarto.org - a website about, and also built with, Quarto—up to date. Prior to Posit, she taught Statistics and Data Science at Oregon State University, where she received awards for her in-person and online teaching.
